Alternative portfolio optimization
Introduction to Portfolio Analysis in Python

Charlotte Werger
Data Scientist
Expected risk and return based on historic data
$$
- Mean historic returns, or the historic portfolio variance are not perfect estimates of mu and Sigma
- Weights from portfolio optimization therefore not guaranteed to work well on future data
$$

Historic data

Exponentially weighted returns
$$
- Need better measures for risk and return
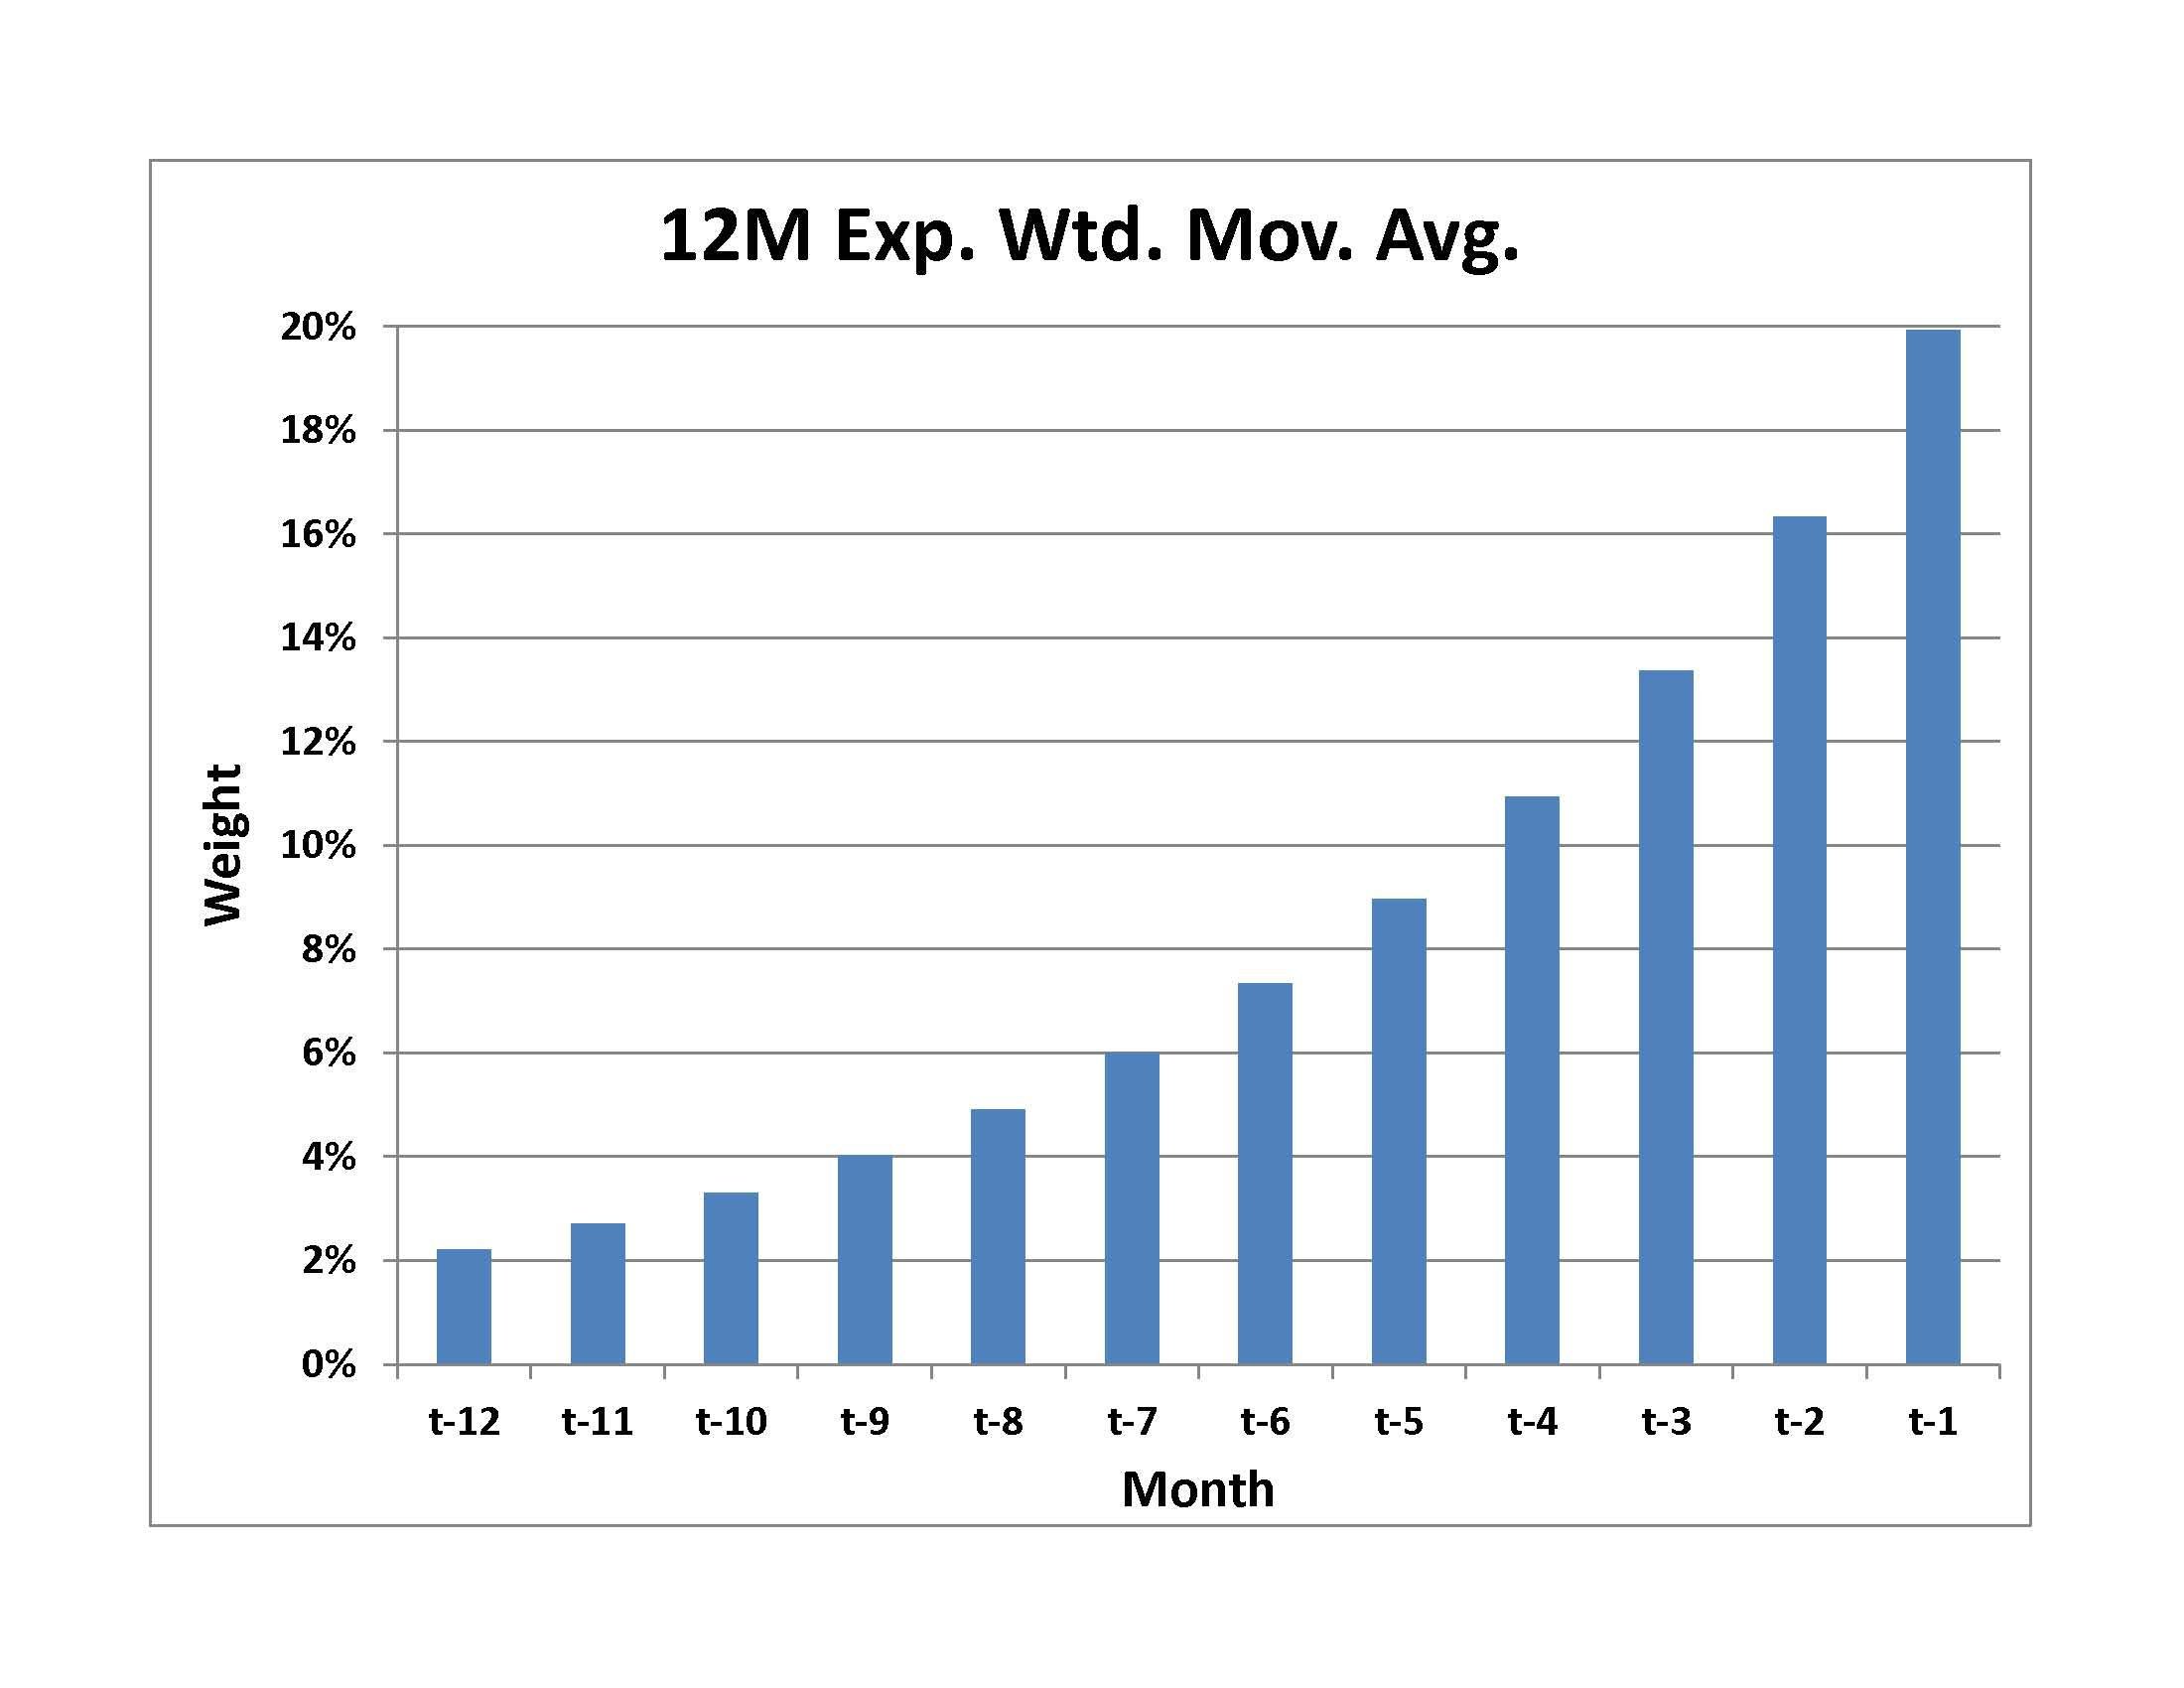
- Exponentially weighted risk and return assigns more importance to the most recent data
- Exponential moving average in the graph: most weight on t-1 observation

Exponentially weighted covariance
$$
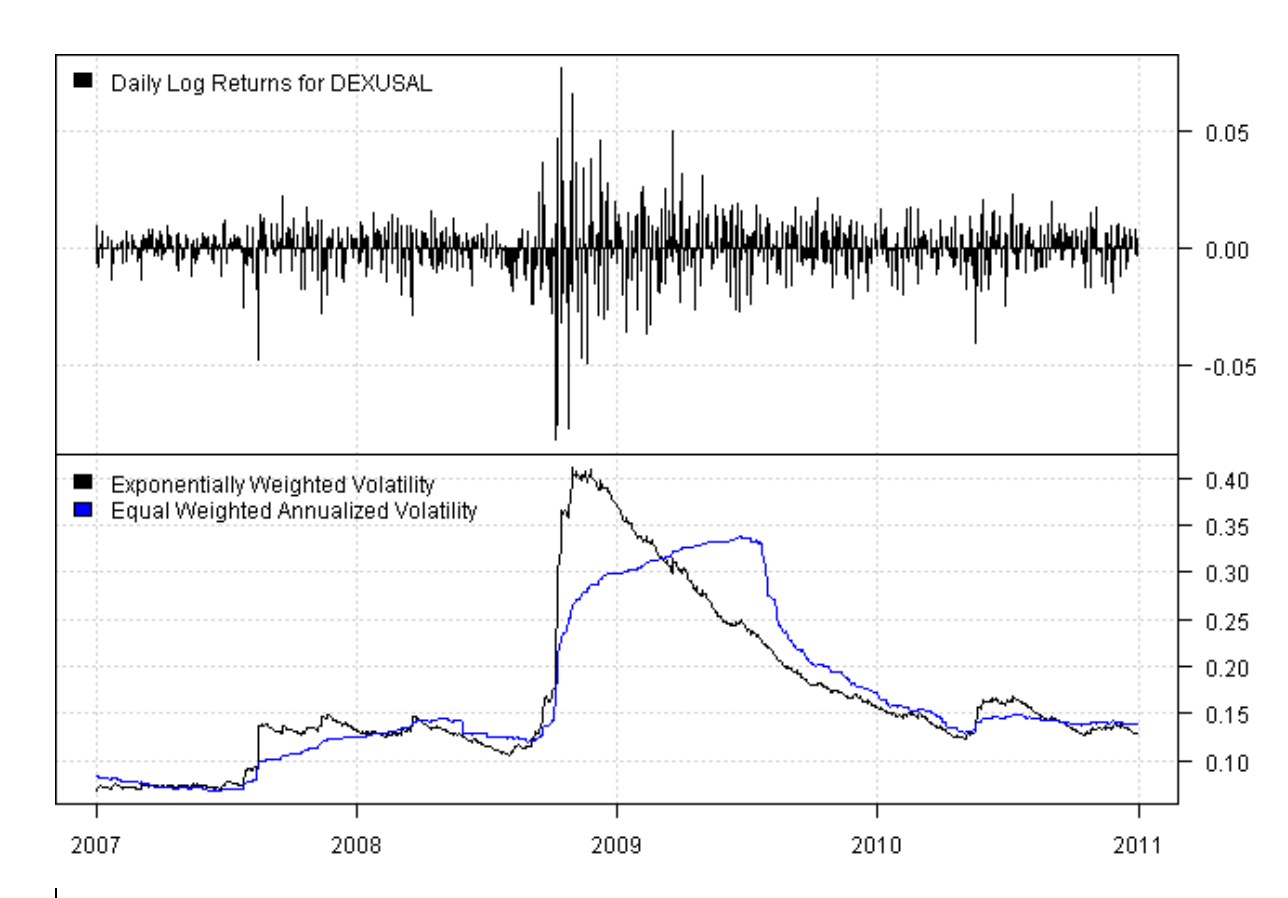
- The exponential covariance matrix: gives more weight to recent data
- In the graph: exponential weighted volatility in black, follows real volatility better than standard volatility in blue
$$

1 Source: https://systematicinvestor.github.io/Exponentially-Weighted-Volatility-RCPP
Exponentially weighted returns
from pypfopt import expected_returns
# Exponentially weighted moving average
mu_ema = expected_returns.ema_historical_return(df,
                         span=252, frequency=252)
print(mu_ema)
symbol
XOM     0.103030
BBY     0.394629
PFE     0.186058
Exponentially weighted covariance
from pypfopt import risk_models
# Exponentially weighted covariance
Sigma_ew = risk_models.exp_cov(df, span=180, frequency=252)
Using downside risk in the optimization
$ $
- Remember the Sortino ratio: it uses the variance of negative returns only
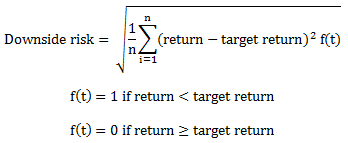
- PyPortfolioOpt allows you to use semicovariance in the optimization, this is a measure for downside risk:
$ $

Semicovariance in PyPortfolioOpt
Sigma_semi = risk_models.semicovariance(df,
                        benchmark=0, frequency=252)

print(Sigma_semi)
         XOM         BBY          MA         PFE
XOM     0.018939    0.008505    0.006568    0.004058
BBY     0.008505    0.016797    0.009133    0.004404
MA      0.006568    0.009133    0.018711    0.005373
PFE     0.004058    0.004404    0.005373    0.008349
Let's practice!
Introduction to Portfolio Analysis in Python

