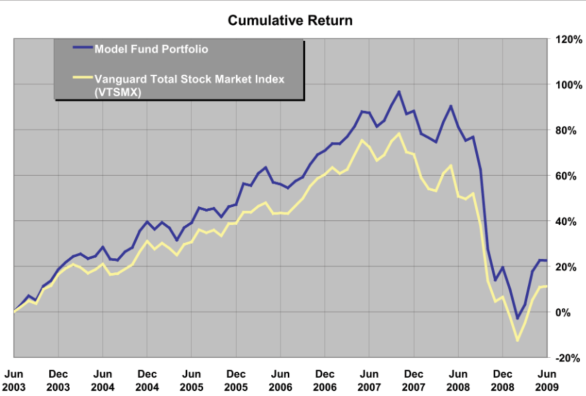
Comparing against a benchmark
Introduction to Portfolio Analysis in Python

Charlotte Werger
Data Scientist
Active investing against a benchmark
Active weights
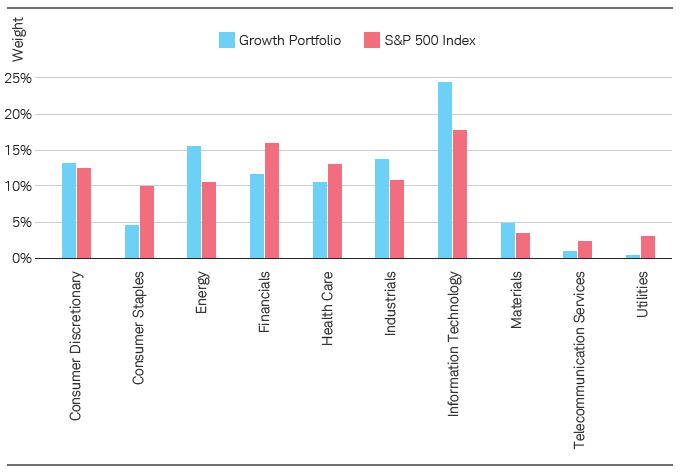
1 Source: Schwab Center for Financial Research.
Introduction to Portfolio Analysis in Python
Charlotte Werger
Data Scientist

