Factor models
Introduction to Portfolio Analysis in Python

Charlotte Werger
Data Scientist
Using factors to explain performance
$$
- Factors are used for risk management.
- Factors are used to help explain performance.
- Factor models help you relate factors to portfolio returns
- Empirical factor models exist that have been tested on historic data.
- Fama French 3 factor model is a well-known factor model.
Fama French Multi Factor model
$ $
$ R_{pf} = \alpha + \beta_m MKT + \beta_s SMB + \beta_h HML $
MKT is the excess return of the market, i.e. $R_m - R_f$
- SMB (Small Minus Big) a size factor
- HML (High Minus Low) a value factor
Regression model refresher

Difference between beta and correlation

Regression model in Python
import statsmodels.api as sm
# Define the model
model = sm.OLS(factor_data['sp500'],
               factor_data[['momentum','value']]).fit()
# Get the model predictions
predictions = model.predict(factor_data[['momentum','value']])
b1, b2 = model.params
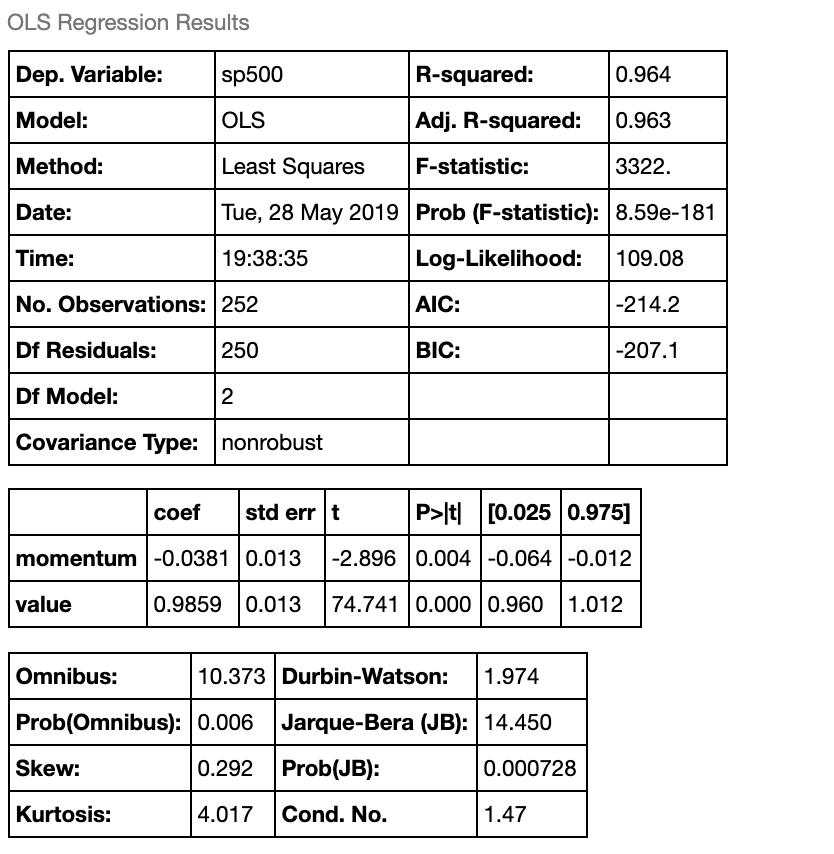
The regression summary output
# Print out the summary statistics
model.summary()

Obtaining betas quickly
# Get just beta coefficients from linear regression model
b1, b2 = regression.linear_model.OLS(df['returns'],
                          df[['F1', 'F2']]).fit().params
# Print the coefficients
print 'Sensitivities of active returns to factors:
                \nF1: %f\nF2: %f' %  (b1, b2)
Sensitivities of active returns to factors:
F1: -0.0381
F2: 0.9858
Let's practice!
Introduction to Portfolio Analysis in Python

