Portfolio returns
Introduction to Portfolio Analysis in Python

Charlotte Werger
Data Scientist
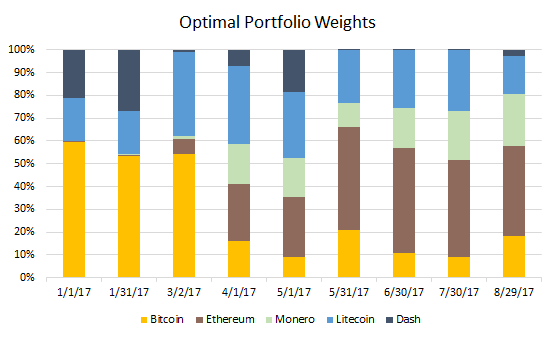
What are portfolio weights?
- Weight is the percentage composition of a particular asset in a portfolio
- All weights together have to sum up to 100%
- Weights and diversification (few large investments versus many small investments)
Calculating portfolio weights
$$
- Calculate by dividing the value of a security by total value of the portfolio
- Equal weighted portfolio, or market cap weighted portfolio
- Weights determine your investment strategy, and can be set to optimize risk and expected return

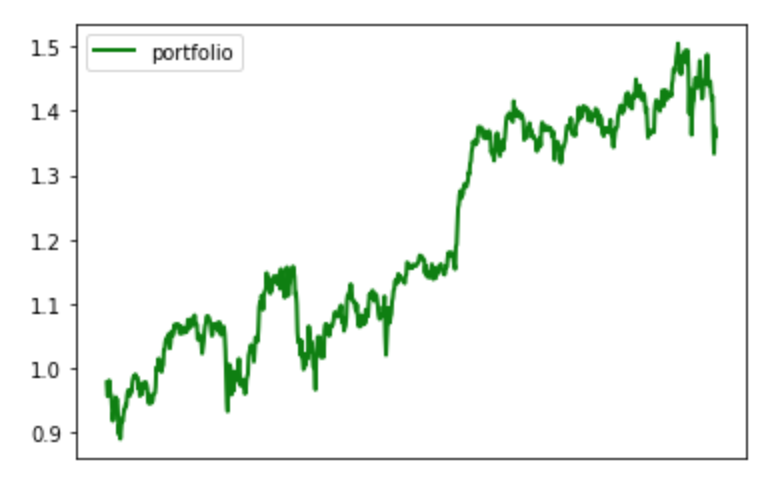
Portfolio returns
Changes in value over time
$ Return_t = \frac{V_t - V_{t-1}}{V_{t-1}} $
Cumulative return plot