Predicting customer transactions
Machine Learning for Marketing in Python

Karolis Urbonas
Head of Analytics & Science, Amazon
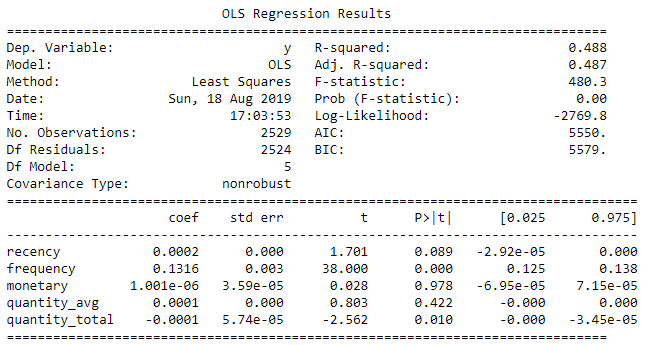
Regression summary table
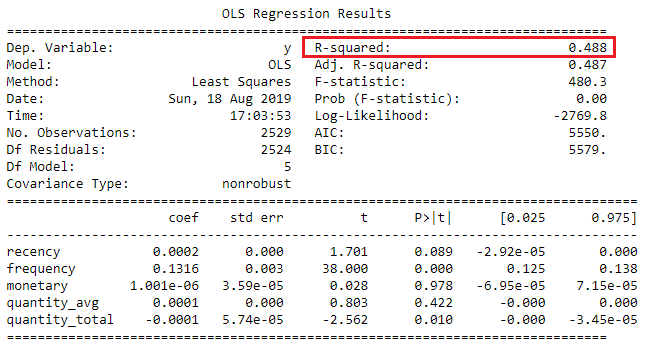
Interpreting R-squared
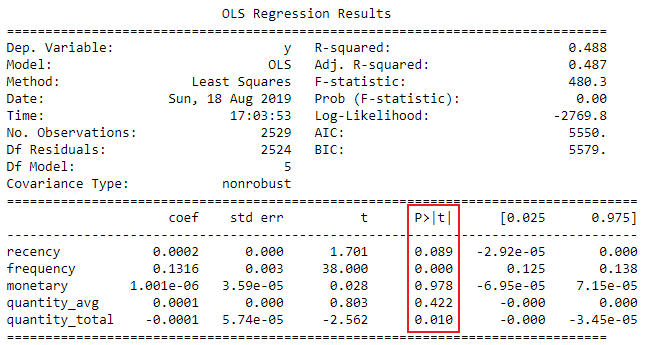
Interpreting coefficient p-values
Machine Learning for Marketing in Python
Karolis Urbonas
Head of Analytics & Science, Amazon

