Visualize and interpret segmentation solutions

Machine Learning for Marketing in Python

Karolis Urbonas

Head of Analytics & Science, Amazon

Methods to explore segments

  • Calculate average / median / other percentile values for each variable by segment
  • Calculate relative importance for each variable by segment
  • We can explore the data table or plot it (heatmap is a good choice)
Machine Learning for Marketing in Python

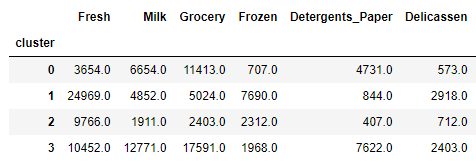
Analyze average K-means segmentation attributes

kmeans4_averages = wholesale_kmeans4.groupby(['segment']).mean().round(0)
print(kmeans4_averages)

K-means 4-segment averages

Machine Learning for Marketing in Python

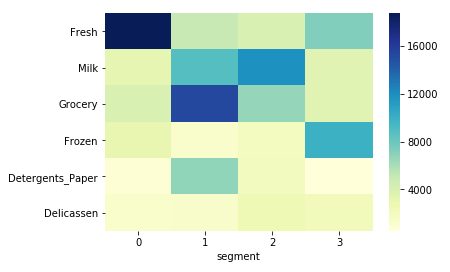
Plot average K-means segmentation attributes

sns.heatmap(kmeans4_averages.T, cmap='YlGnBu')
plt.show()

K-means 4-segment averages heatmap

Machine Learning for Marketing in Python

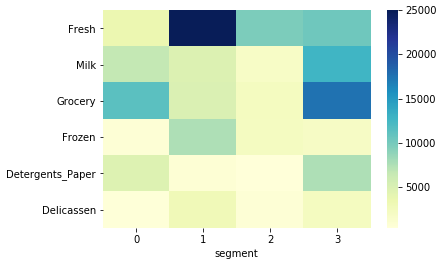
Plot average NMF segmentation attributes

nmf4_averages = wholesale_nmf4.groupby('segment').mean().round(0)
sns.heatmap(nmf4_averages.T, cmap='YlGnBu')
plt.show()

NMF average heatmap

Machine Learning for Marketing in Python

Let's build 3-segment solutions!

Machine Learning for Marketing in Python

Preparing Video For Download...