Customer and product segmentation basics
Machine Learning for Marketing in Python

Karolis Urbonas
Head of Analytics & Science, Amazon
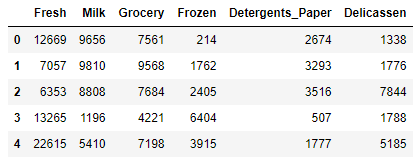
Data format
# Customer by product/service matrix
wholesale.head()
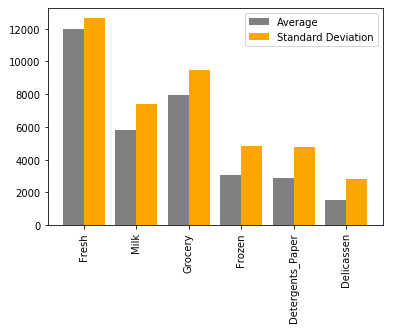
Bar chart of averages and standard deviations
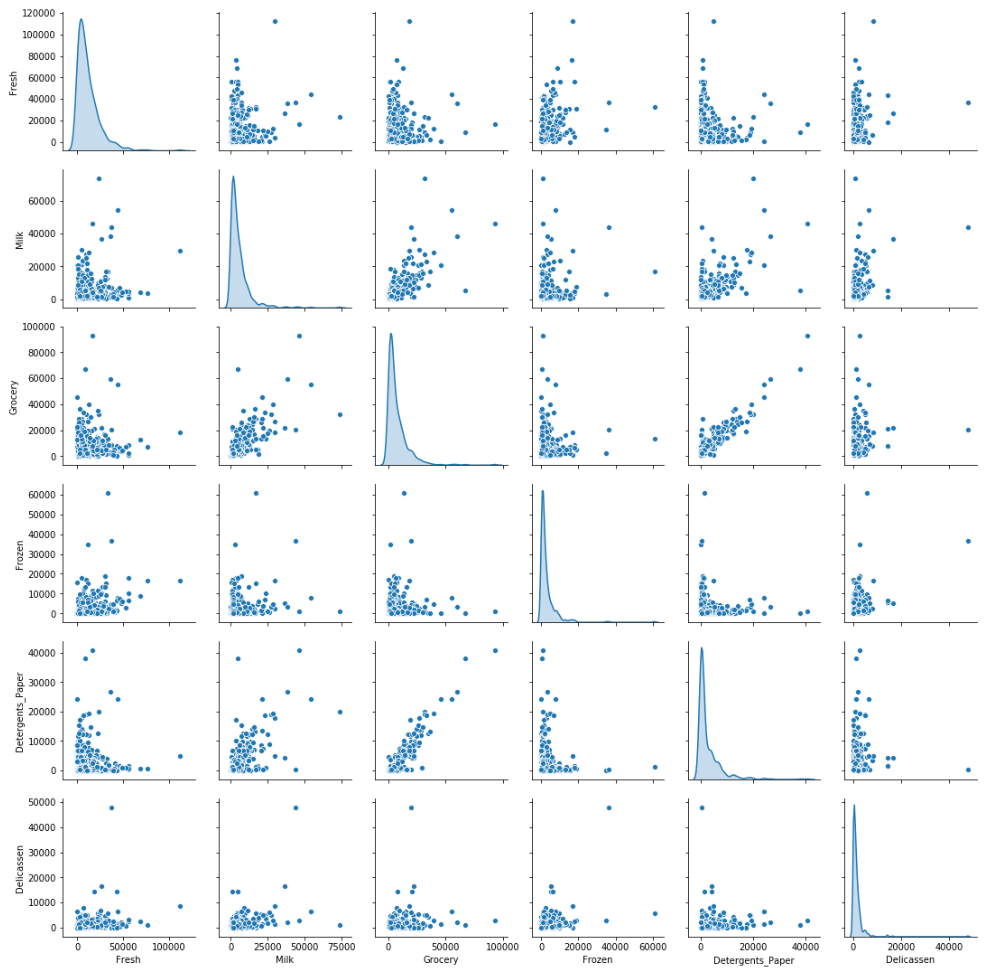
Pairwise plot review