Exploring data with dplyr
Data Manipulation with dplyr

James Chapman
Curriculum Manager, DataCamp
The dplyr package
- Part of the
tidyversecollection - Specializes in data manipulation
- Install
dplyronly:install.packages("dplyr")
- Install entire
tidyverse, inc.dplyr:install.packages("tidyverse")
1 Wickham H, Averick M, Bryan J, Chang W, McGowan LD, François R, Grolemund G, et al. (2019). "Welcome to the tidyverse." Journal of Open Source Software, 4(43), 1686. doi:10.21105/joss.01686.
Chapter 1 verbs
select()filter()arrange()mutate()
2015 United States Census
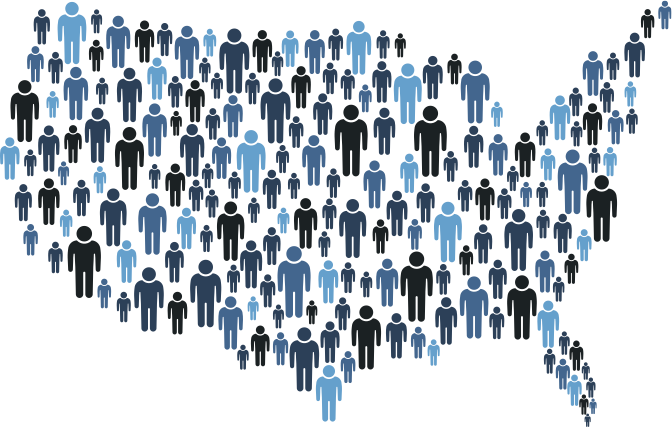
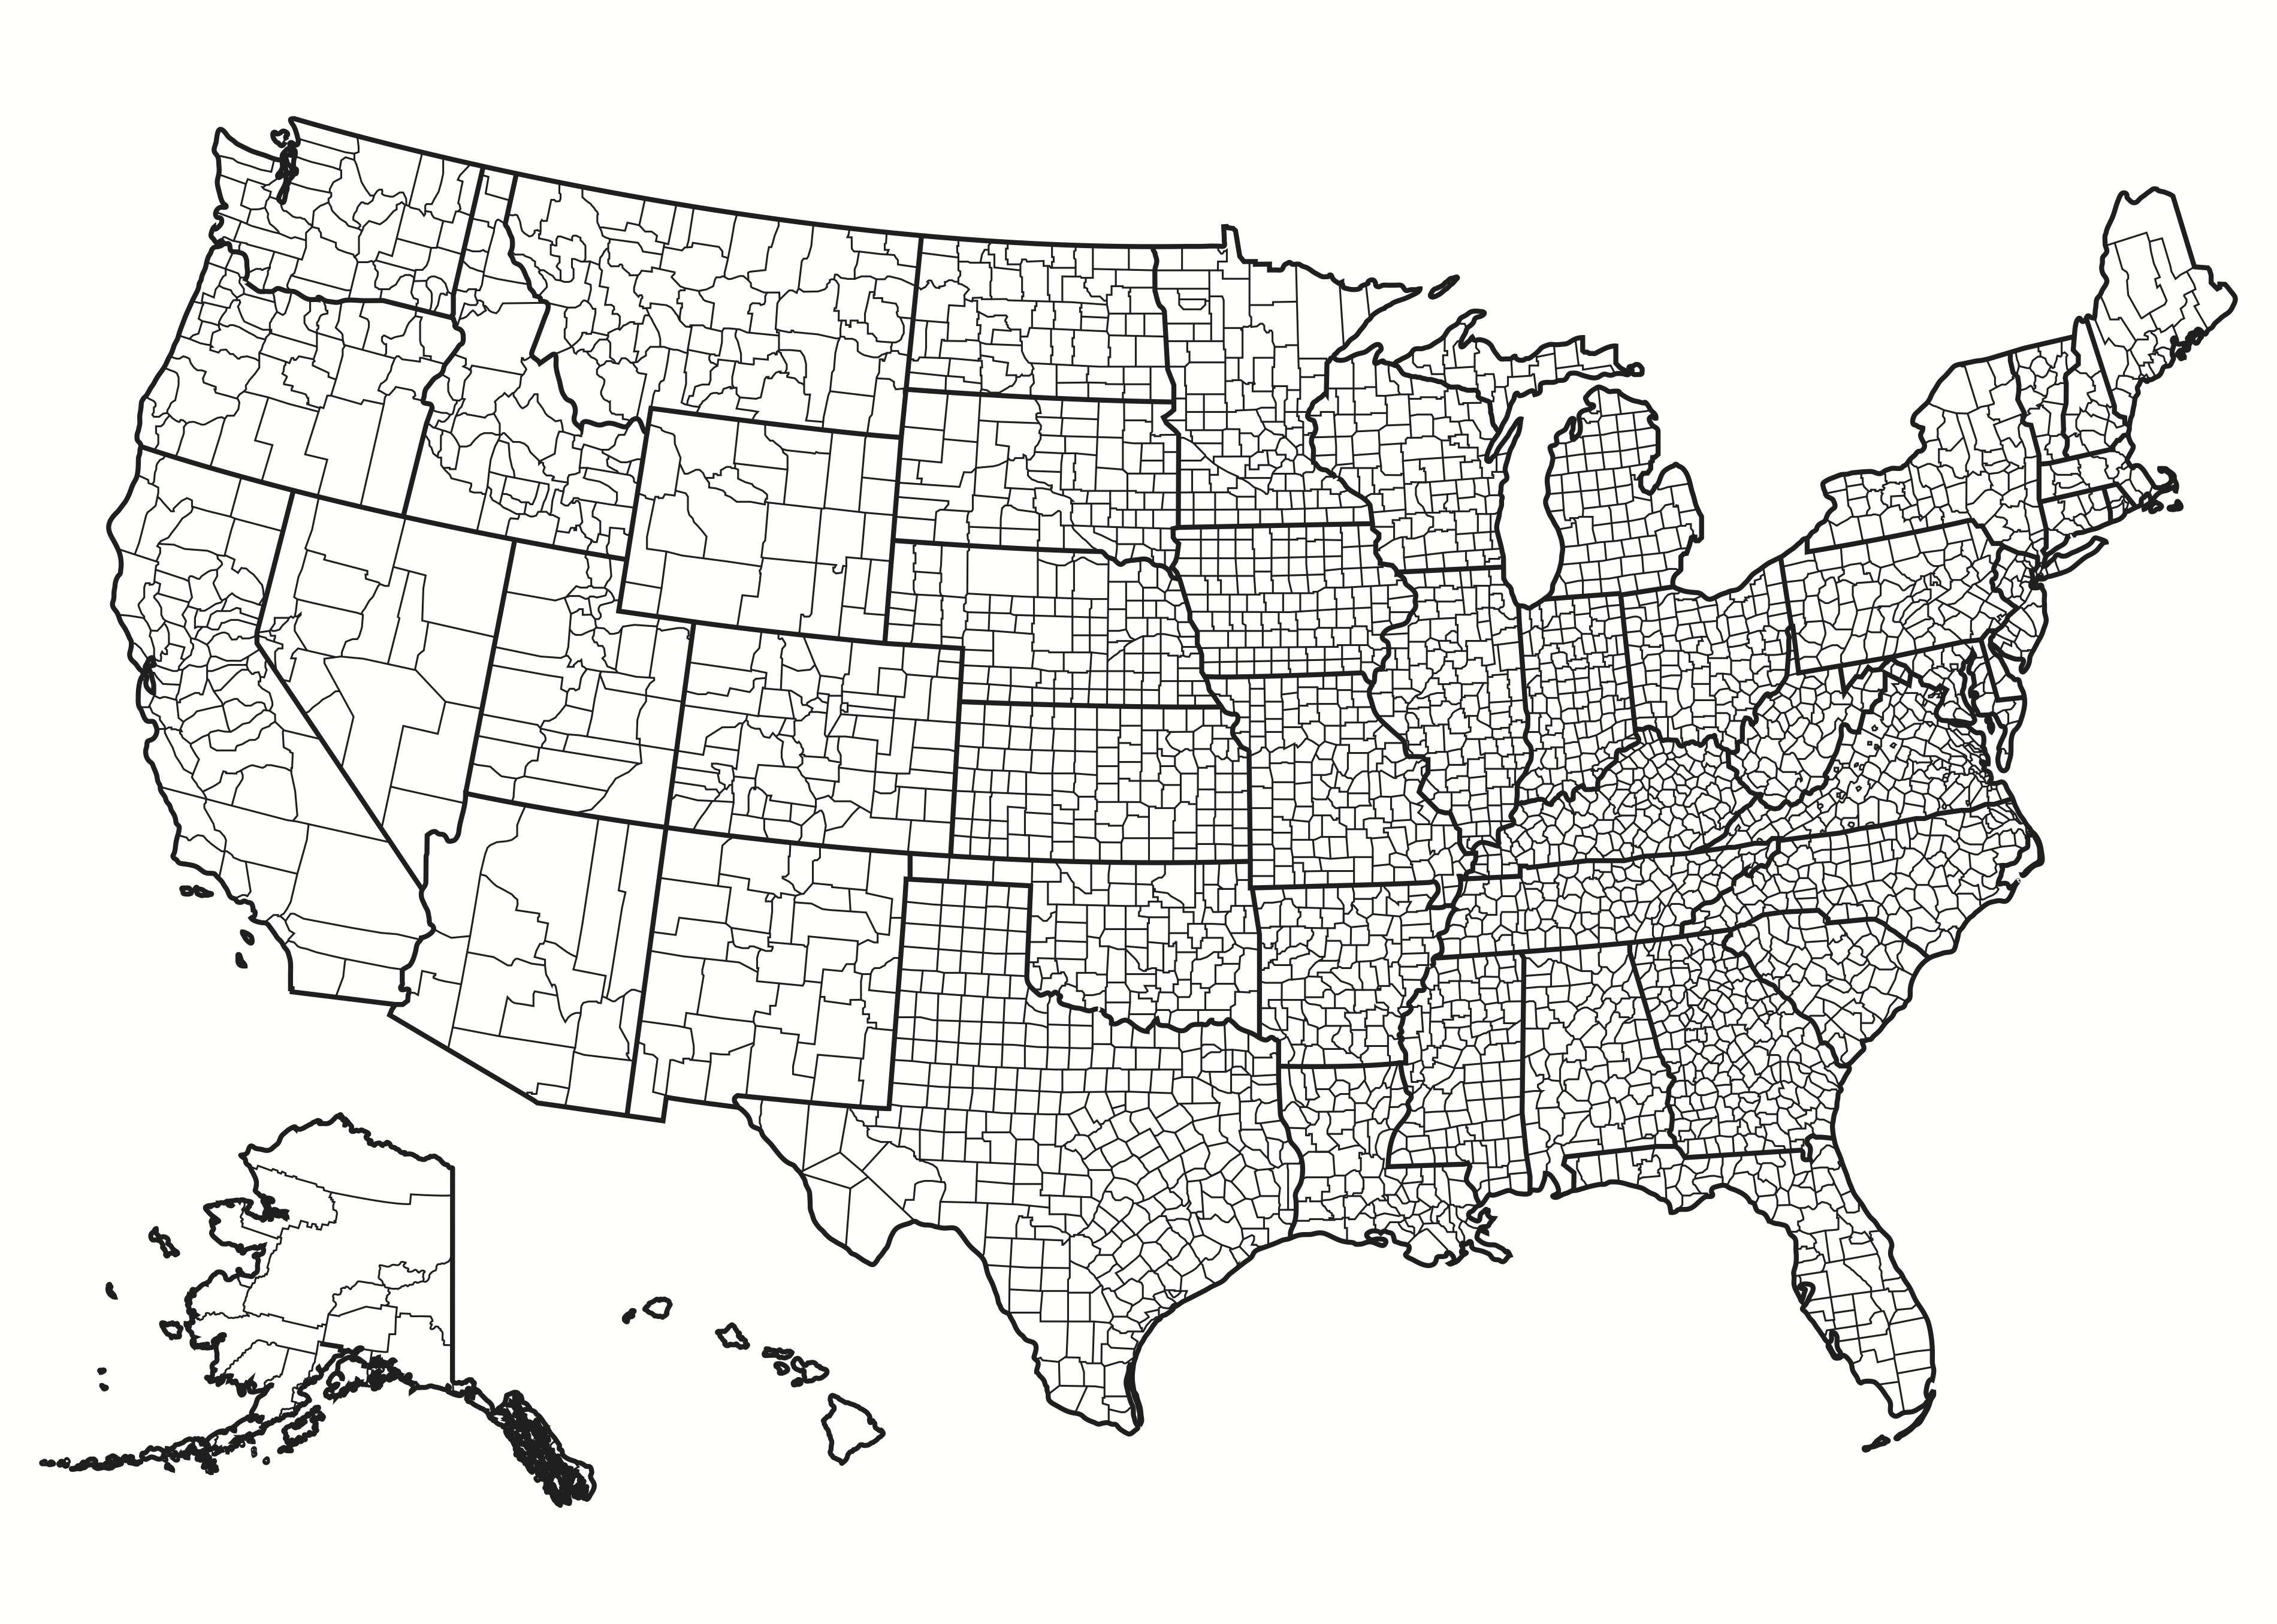
counties dataset
counties
# A tibble: 3,138 x 40
   census_id state county region metro population   men women hispanic white black native asian pacific
   <chr>     <chr> <chr>  <chr>  <chr>      <dbl> <dbl> <dbl>    <dbl> <dbl> <dbl>  <dbl> <dbl>   <dbl>
 1 1001      Alab… Autau… South  Metro      55221 26745 28476      2.6  75.8  18.5    0.4   1         0
 2 1003      Alab… Baldw… South  Metro     195121 95314 99807      4.5  83.1   9.5    0.6   0.7       0
 3 1005      Alab… Barbo… South  Nonm…      26932 14497 12435      4.6  46.2  46.7    0.2   0.4       0
 4 1007      Alab… Bibb   South  Metro      22604 12073 10531      2.2  74.5  21.4    0.4   0.1       0
 5 1009      Alab… Blount South  Metro      57710 28512 29198      8.6  87.9   1.5    0.3   0.1       0
 6 1011      Alab… Bullo… South  Nonm…      10678  5660  5018      4.4  22.2  70.7    1.2   0.2       0
 7 1013      Alab… Butler South  Nonm…      20354  9502 10852      1.2  53.3  43.8    0.1   0.4       0
 8 1015      Alab… Calho… South  Metro     116648 56274 60374      3.5  73    20.3    0.2   0.9       0
 9 1017      Alab… Chamb… South  Nonm…      34079 16258 17821      0.4  57.3  40.3    0.2   0.8       0
10 1019      Alab… Chero… South  Nonm…      26008 12975 13033      1.5  91.7   4.8    0.6   0.3       0
# … with 3,128 more rows, and 26 more variables: citizens <dbl>, income <dbl>, income_err <dbl>,
#   income_per_cap <dbl>, income_per_cap_err <dbl>, poverty <dbl>, child_poverty <dbl>,
#   professional <dbl>, service <dbl>, office <dbl>, construction <dbl>, production <dbl>, drive <dbl>,
#   carpool <dbl>, transit <dbl>, walk <dbl>, other_transp <dbl>, work_at_home <dbl>, mean_commute <dbl>,
#   employed <dbl>, private_work <dbl>, public_work <dbl>, self_employed <dbl>, family_work <dbl>,
#   unemployment <dbl>, land_area <dbl>
glimpse(counties)
Observations: 3,138
Variables: 40
$ census_id          <chr> "1001", "1003", "1005", "1007", "1009", "1011", "1013", …
$ state              <chr> "Alabama", "Alabama", "Alabama", "Alabama", "Alabama", "…
$ county             <chr> "Autauga", "Baldwin", "Barbour", "Bibb", "Blount", "Bull…
$ region             <chr> "South", "South", "South", "South", "South", "South", "S…
$ metro              <chr> "Metro", "Metro", "Nonmetro", "Metro", "Metro", "Nonmetr…
$ population         <dbl> 55221, 195121, 26932, 22604, 57710, 10678, 20354, 116648…
$ men                <dbl> 26745, 95314, 14497, 12073, 28512, 5660, 9502, 56274, 16…
$ women              <dbl> 28476, 99807, 12435, 10531, 29198, 5018, 10852, 60374, 1…
$ hispanic           <dbl> 2.6, 4.5, 4.6, 2.2, 8.6, 4.4, 1.2, 3.5, 0.4, 1.5, 7.6, 0…
$ white              <dbl> 75.8, 83.1, 46.2, 74.5, 87.9, 22.2, 53.3, 73.0, 57.3, 91…
$ black              <dbl> 18.5, 9.5, 46.7, 21.4, 1.5, 70.7, 43.8, 20.3, 40.3, 4.8,…
$ native             <dbl> 0.4, 0.6, 0.2, 0.4, 0.3, 1.2, 0.1, 0.2, 0.2, 0.6, 0.4, 0…
$ asian              <dbl> 1.0, 0.7, 0.4, 0.1, 0.1, 0.2, 0.4, 0.9, 0.8, 0.3, 0.3, 0…
$ pacific            <dbl> 0.0, 0.0, 0.0, 0.0, 0.0, 0.0, 0.0, 0.0, 0.0, 0.0, 0.0, 0…
$ citizens           <dbl> 40725, 147695, 20714, 17495, 42345, 8057, 15581, 88612, …
$ income             <dbl> 51281, 50254, 32964, 38678, 45813, 31938, 32229, 41703, …
...
select() verb
counties %>%select(state, county, population, unemployment)
# A tibble: 3,138 x 4
   state   county   population unemployment
   <chr>   <chr>         <dbl>        <dbl>
 1 Alabama Autauga       55221          7.6
 2 Alabama Baldwin      195121          7.5
 3 Alabama Barbour       26932         17.6
 4 Alabama Bibb          22604          8.3
 5 Alabama Blount        57710          7.7
 6 Alabama Bullock       10678         18
 7 Alabama Butler        20354         10.9
 8 Alabama Calhoun      116648         12.3
 9 Alabama Chambers      34079          8.9
10 Alabama Cherokee      26008          7.9
# … with 3,128 more rows
Creating a new table
counties_selected <- counties %>%
  select(state, county, population, unemployment)
counties_selected
# A tibble: 3,138 x 4
   state   county   population unemployment
   <chr>   <chr>         <dbl>        <dbl>
 1 Alabama Autauga       55221          7.6
 2 Alabama Baldwin      195121          7.5
 3 Alabama Barbour       26932         17.6
 4 Alabama Bibb          22604          8.3
 5 Alabama Blount        57710          7.7
 6 Alabama Bullock       10678         18
 7 Alabama Butler        20354         10.9
 8 Alabama Calhoun      116648         12.3
 9 Alabama Chambers      34079          8.9
10 Alabama Cherokee      26008          7.9
# … with 3,128 more rows
Let's practice!
Data Manipulation with dplyr

