Visualizing metrics
Market Basket Analysis in R

Christopher Bruffaerts
Statistician
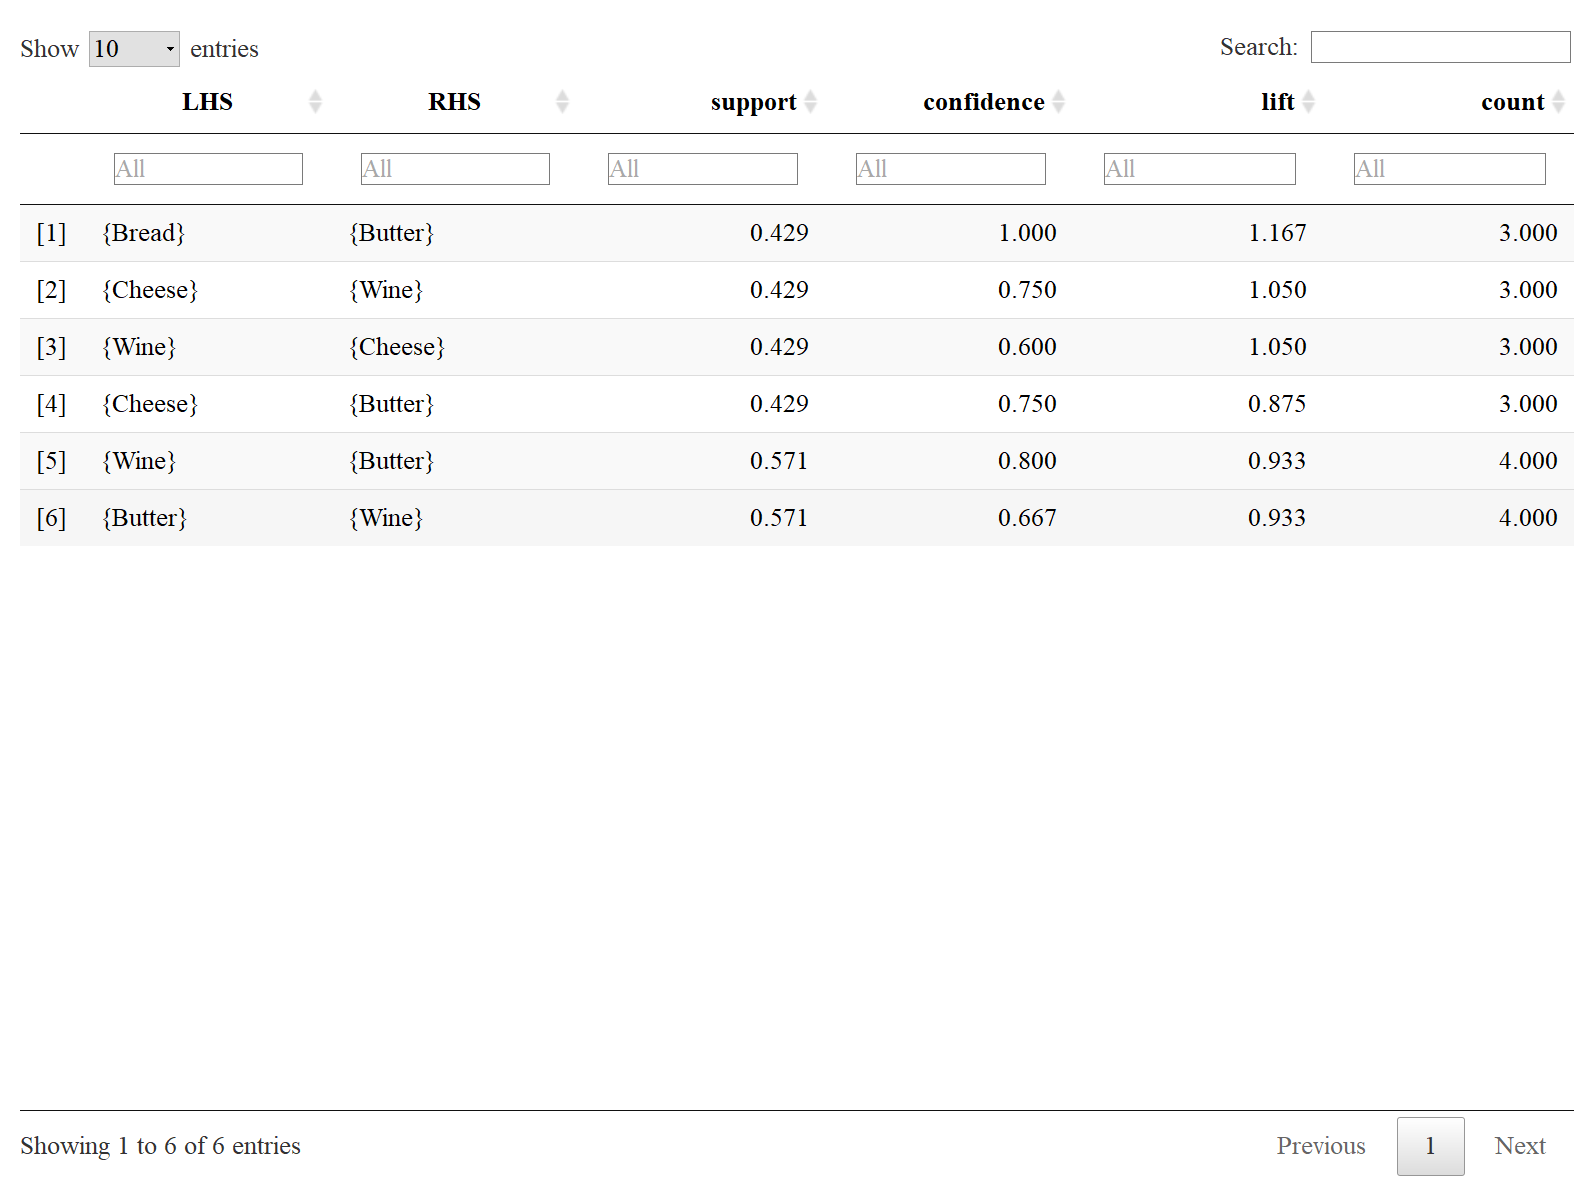
Interactive table with metrics
HTML table
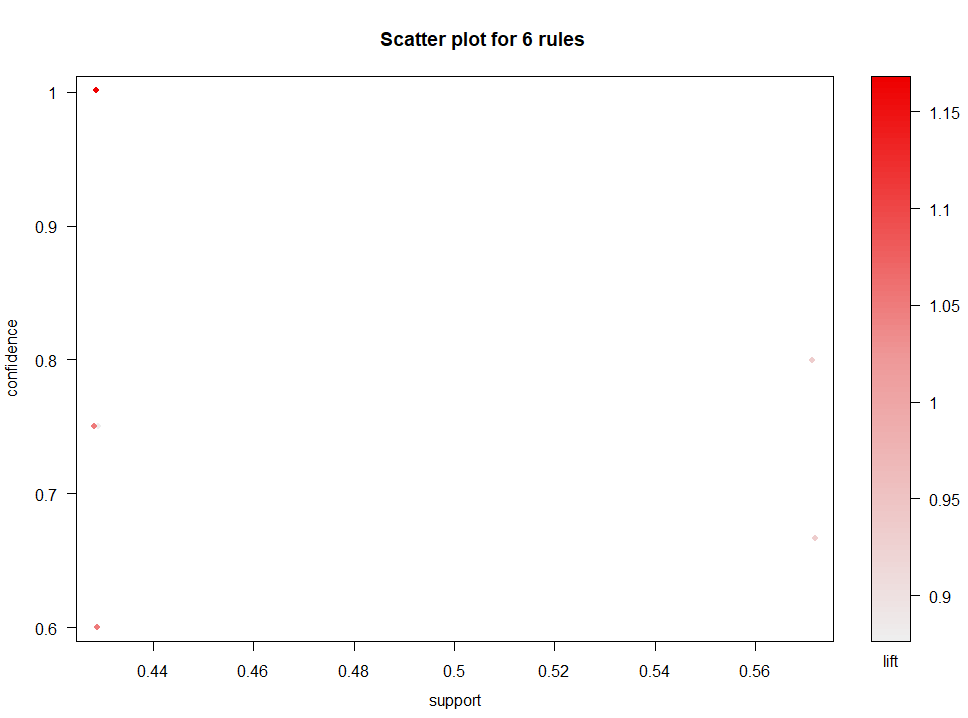
Scatter plots introduction
Scatterplot from arulesViz
plot(rules)
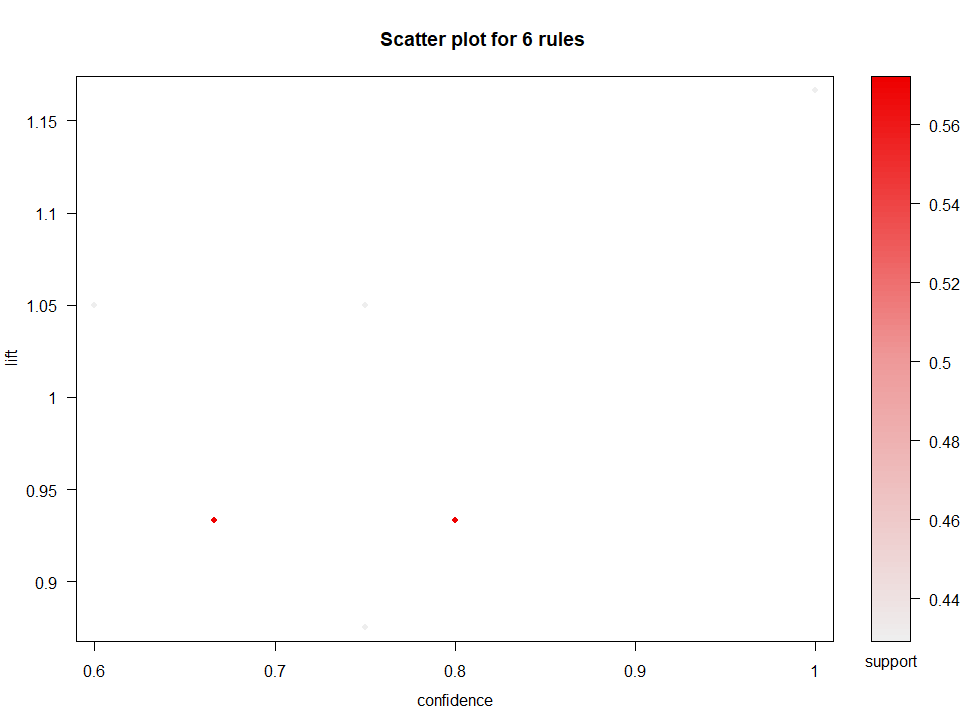
Flexible arules plots
Example
plot(rules, measure = c("confidence", "lift"),
     shading = "support",
     method = "scatterplot")
Other arules plots
Jittering your plots
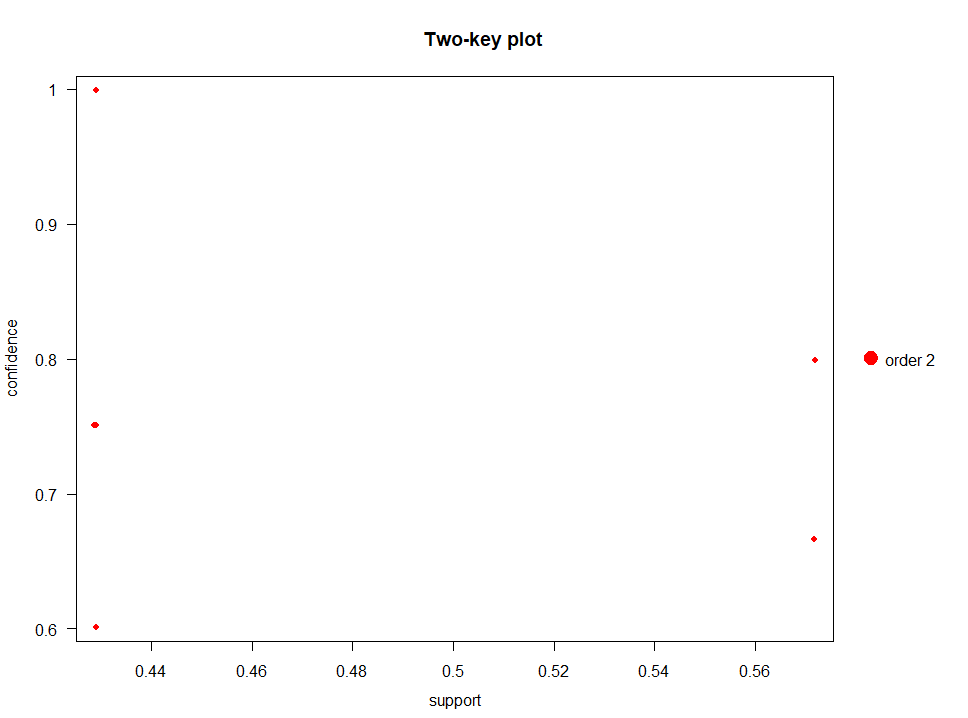
No jittering
plot(rules, method = "two-key plot")
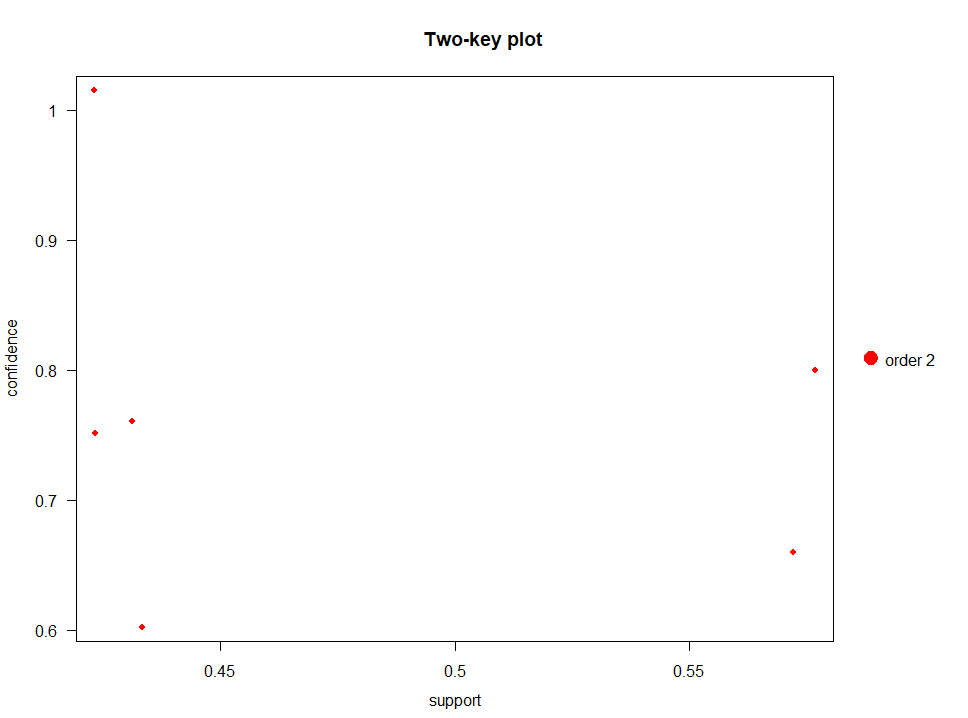
With jittering
plot(rules, method = "two-key plot",jitter = 2)
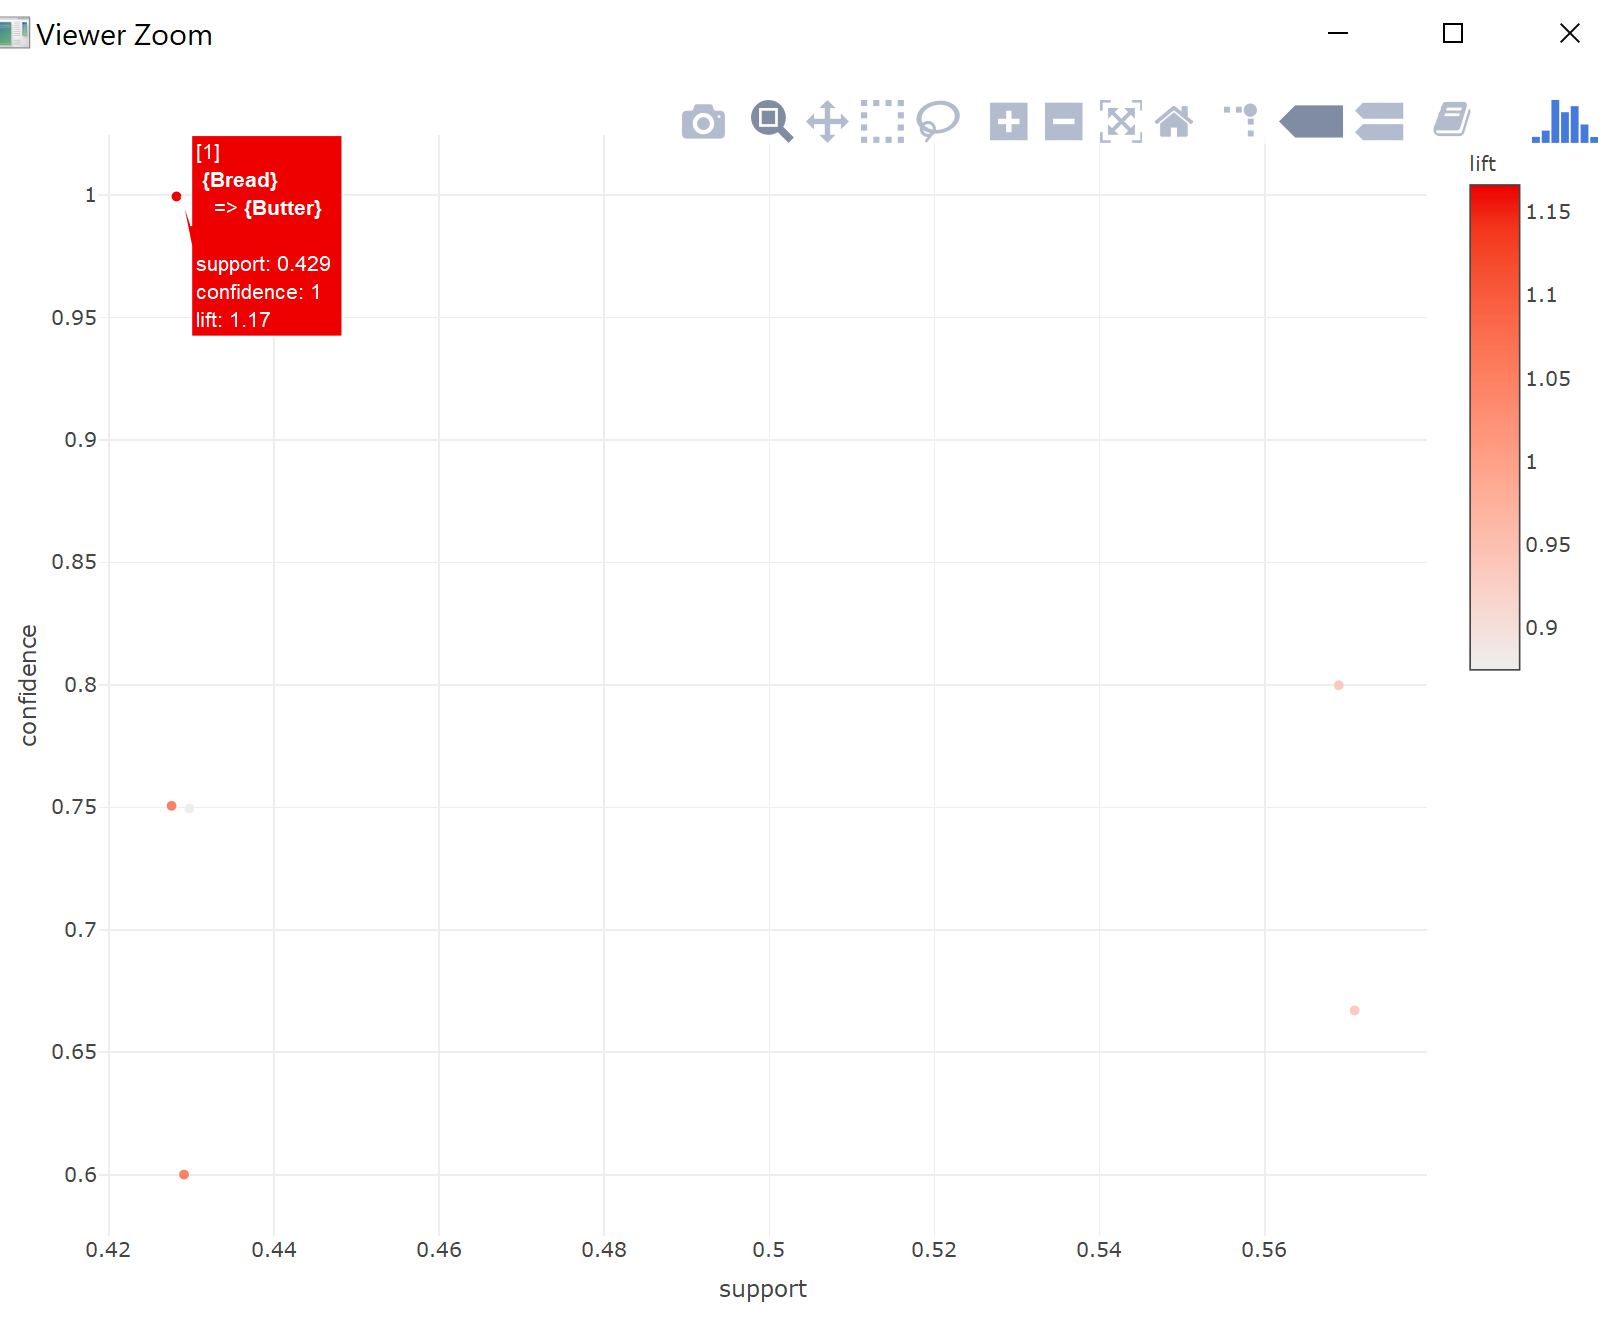
Interactive arules plots
From static to interactive