What is market basket analysis ?
Market Basket Analysis in R

Christopher Bruffaerts
Statistician
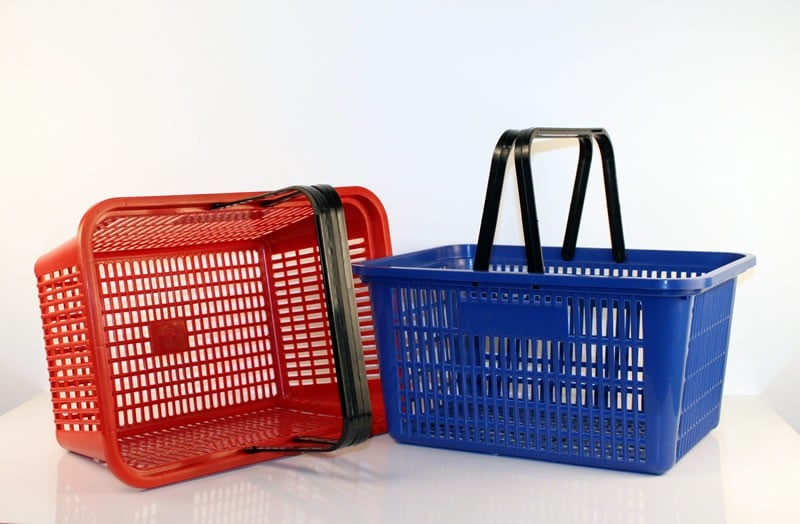
Multiple baskets @ grocery store
What's in the store?
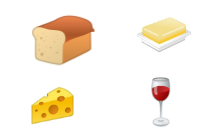
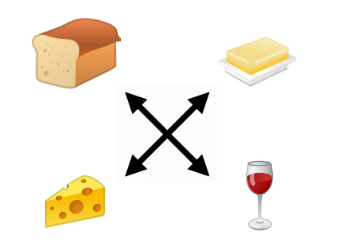
Basket 1: {"Bread", "Cheese"}
Basket 2: {"Bread", "Wine" , "Cheese"}
Multiple baskets
If 100 customers visit the grocery store, can we find associations of items that occur together?
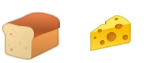
Example: Bread and Cheese
Outcome: “if this, then that”
Market basket applications
Learning from multiple baskets
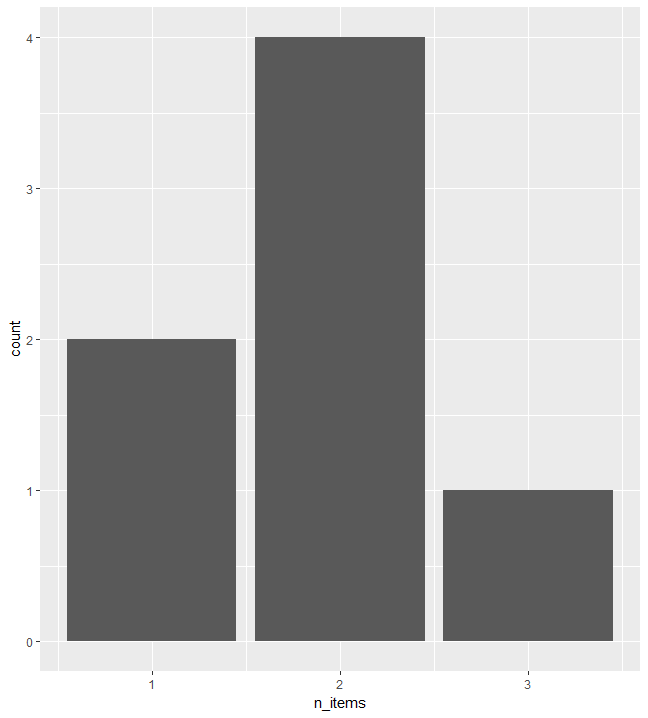
How big are baskets?
Distribution of basket size
# Distribution of distinct items
ggplot(df_basket, aes(n_items)) +
  geom_bar()
Specific products in the baskets
Which item are you looking at?
How many times an item appears across all baskets?
How many baskets contain that item?
Example:
Association rule mining
Association rule mining: finding frequent co-occuring associations among a collection of items.
Example of rule extraction:
- {Bread} $\rightarrow$ {Butter}
- {Bread, Cheese} $\rightarrow$ {Wine}
So what's coming next?
Agenda for the rest of the course:
- Chapter 2: Metrics & techniques in market basket analysis
- Chapter 3: Visualization in market basket analysis
- Chapter 4: Case study: Movie recommendations @ movieLens