Let's see what's in the basket

Market Basket Analysis in R

Christopher Bruffaerts

Statistician

Visualizing items

TID Transaction
1 {Bread, Butter, Cheese, Wine}
2 {Bread, Butter, Wine}
3 {Bread, Butter}
4 {Butter, Cheese, Wine}
5 {Butter, Cheese}
6 {Cheese, Wine}
7 {Butter, Wine}

Item Frequency Plot

freq_basic_abs

Market Basket Analysis in R

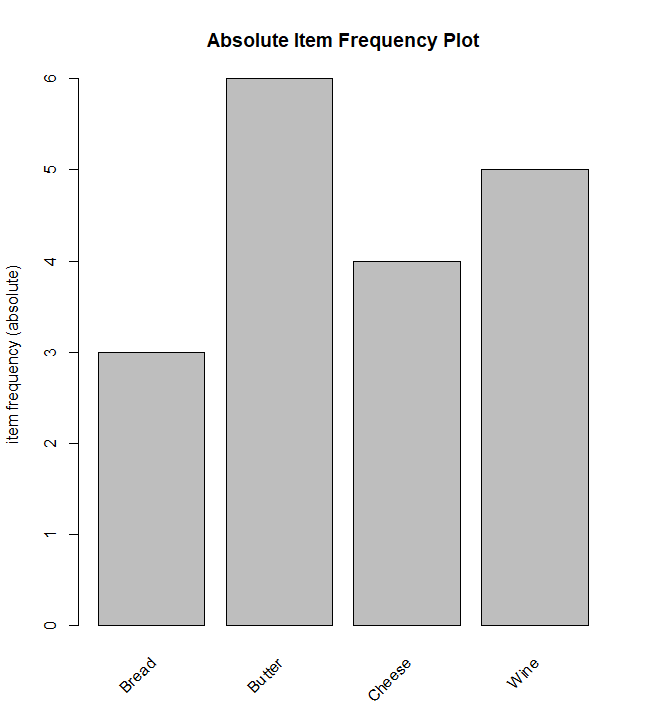
Visualizing items in R
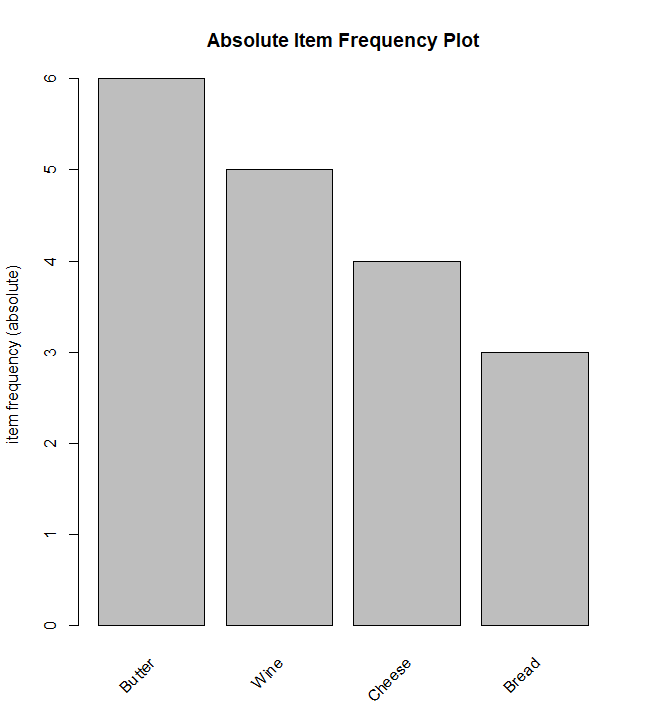
Absolute type

itemFrequencyPlot(data_trx, 
                  main='Absolute Item Frequency Plot',
                  type="absolute"
)

Relative type

itemFrequencyPlot(data_trx,
                  main='Relative Item Frequency Plot',
                  type="relative"
)

freq_basic_abs

item_freq_basic

Market Basket Analysis in R

Top items

Reordering and filtering with topN

itemFrequencyPlot(
  data_trx,
  topN = 4,
  main = 'Absolute Item Frequency Plot',
  type = "absolute"
)

item_freq_abs_top

Market Basket Analysis in R

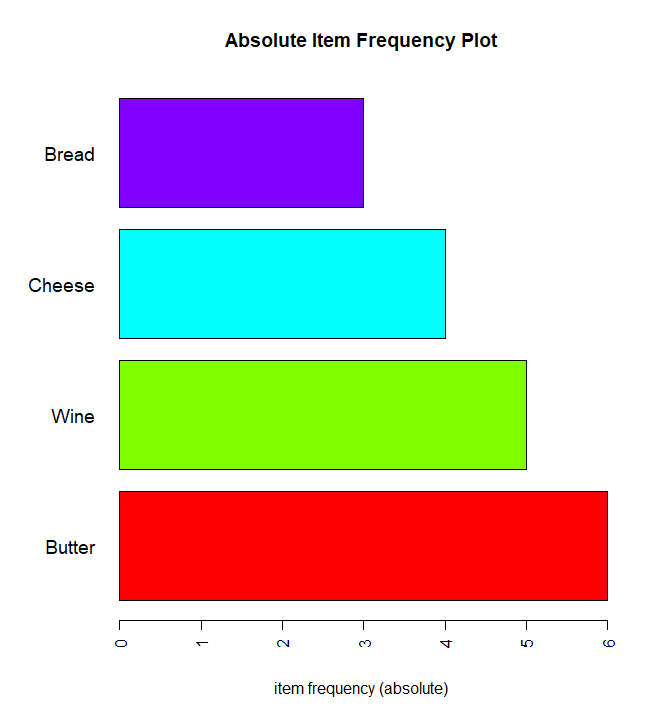
Further customization

Flip & customize plot

itemFrequencyPlot(
  data_trx,
  topN = 4,
  main = 'Absolute Item Frequency Plot',
  type = "absolute",
  col = rainbow(4),
  ylab = "",
  cex.names = 1.2,
  horiz = TRUE
)

item_freq_basic_top_col

Market Basket Analysis in R

Let's plot items!

Market Basket Analysis in R

Preparing Video For Download...