Alternative rule plots
Market Basket Analysis in R

Christopher Bruffaerts
Statistician
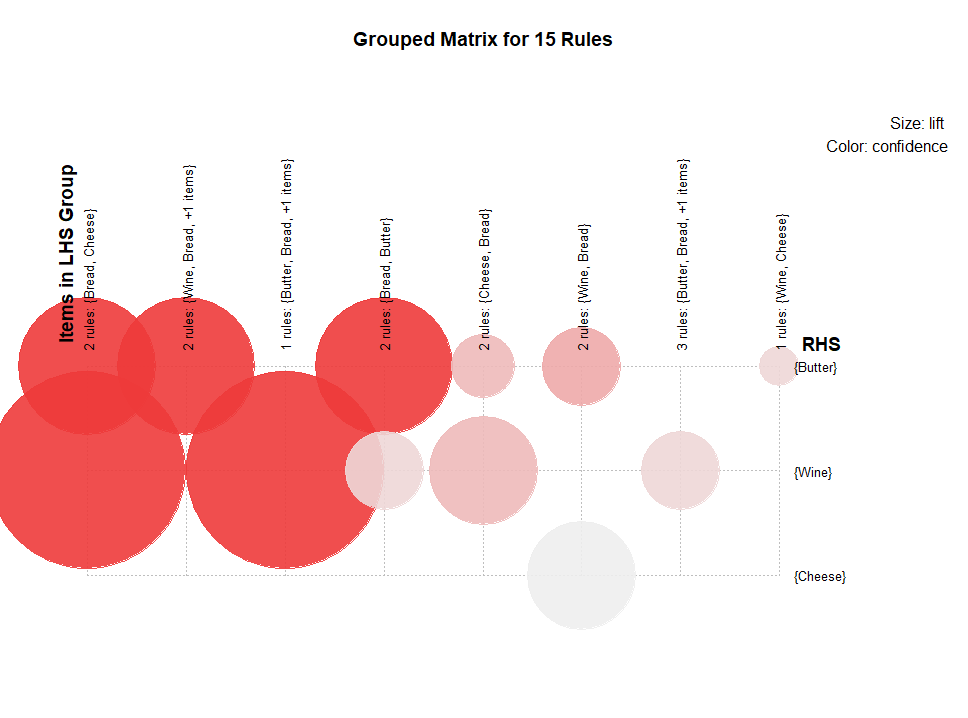
Group-based matrix visualizations
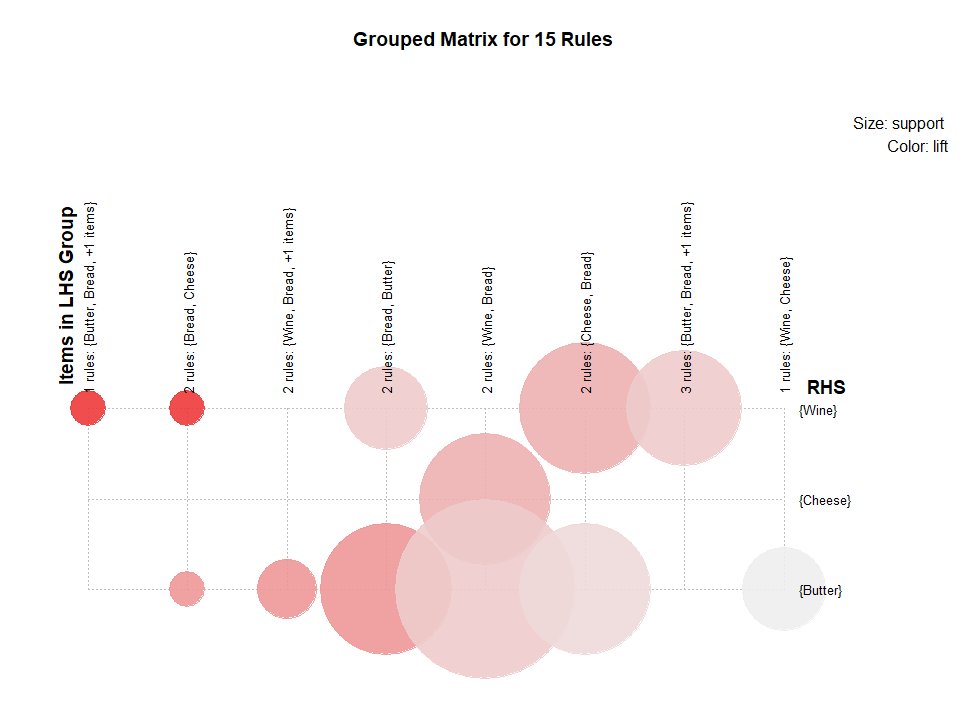
Group-based matrix visualizations
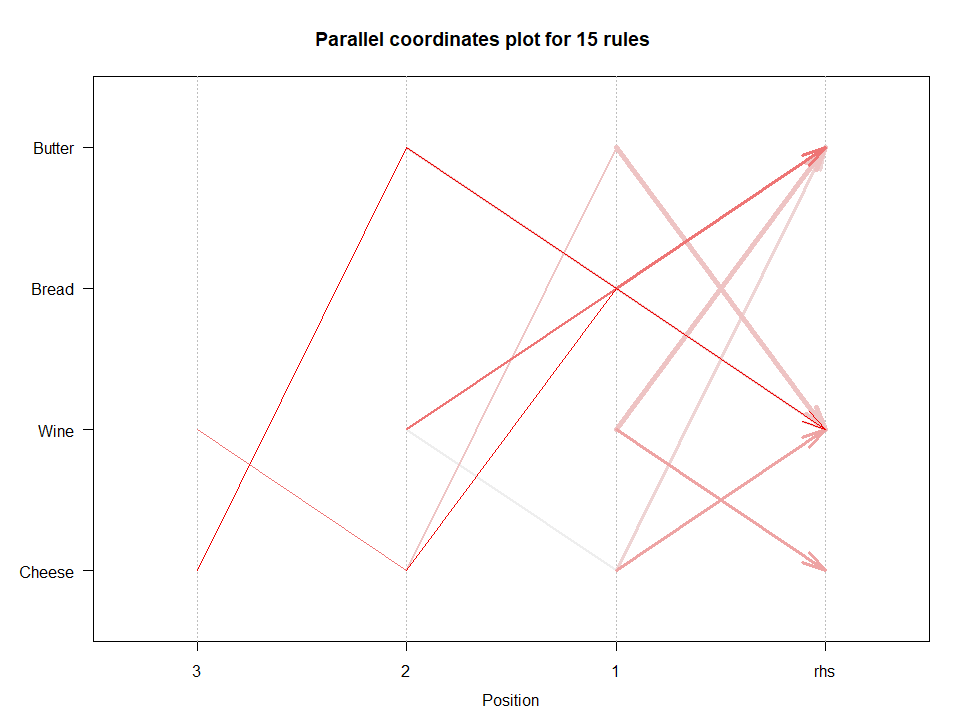
Parallel coordinate plots
Parallel coordinates plot
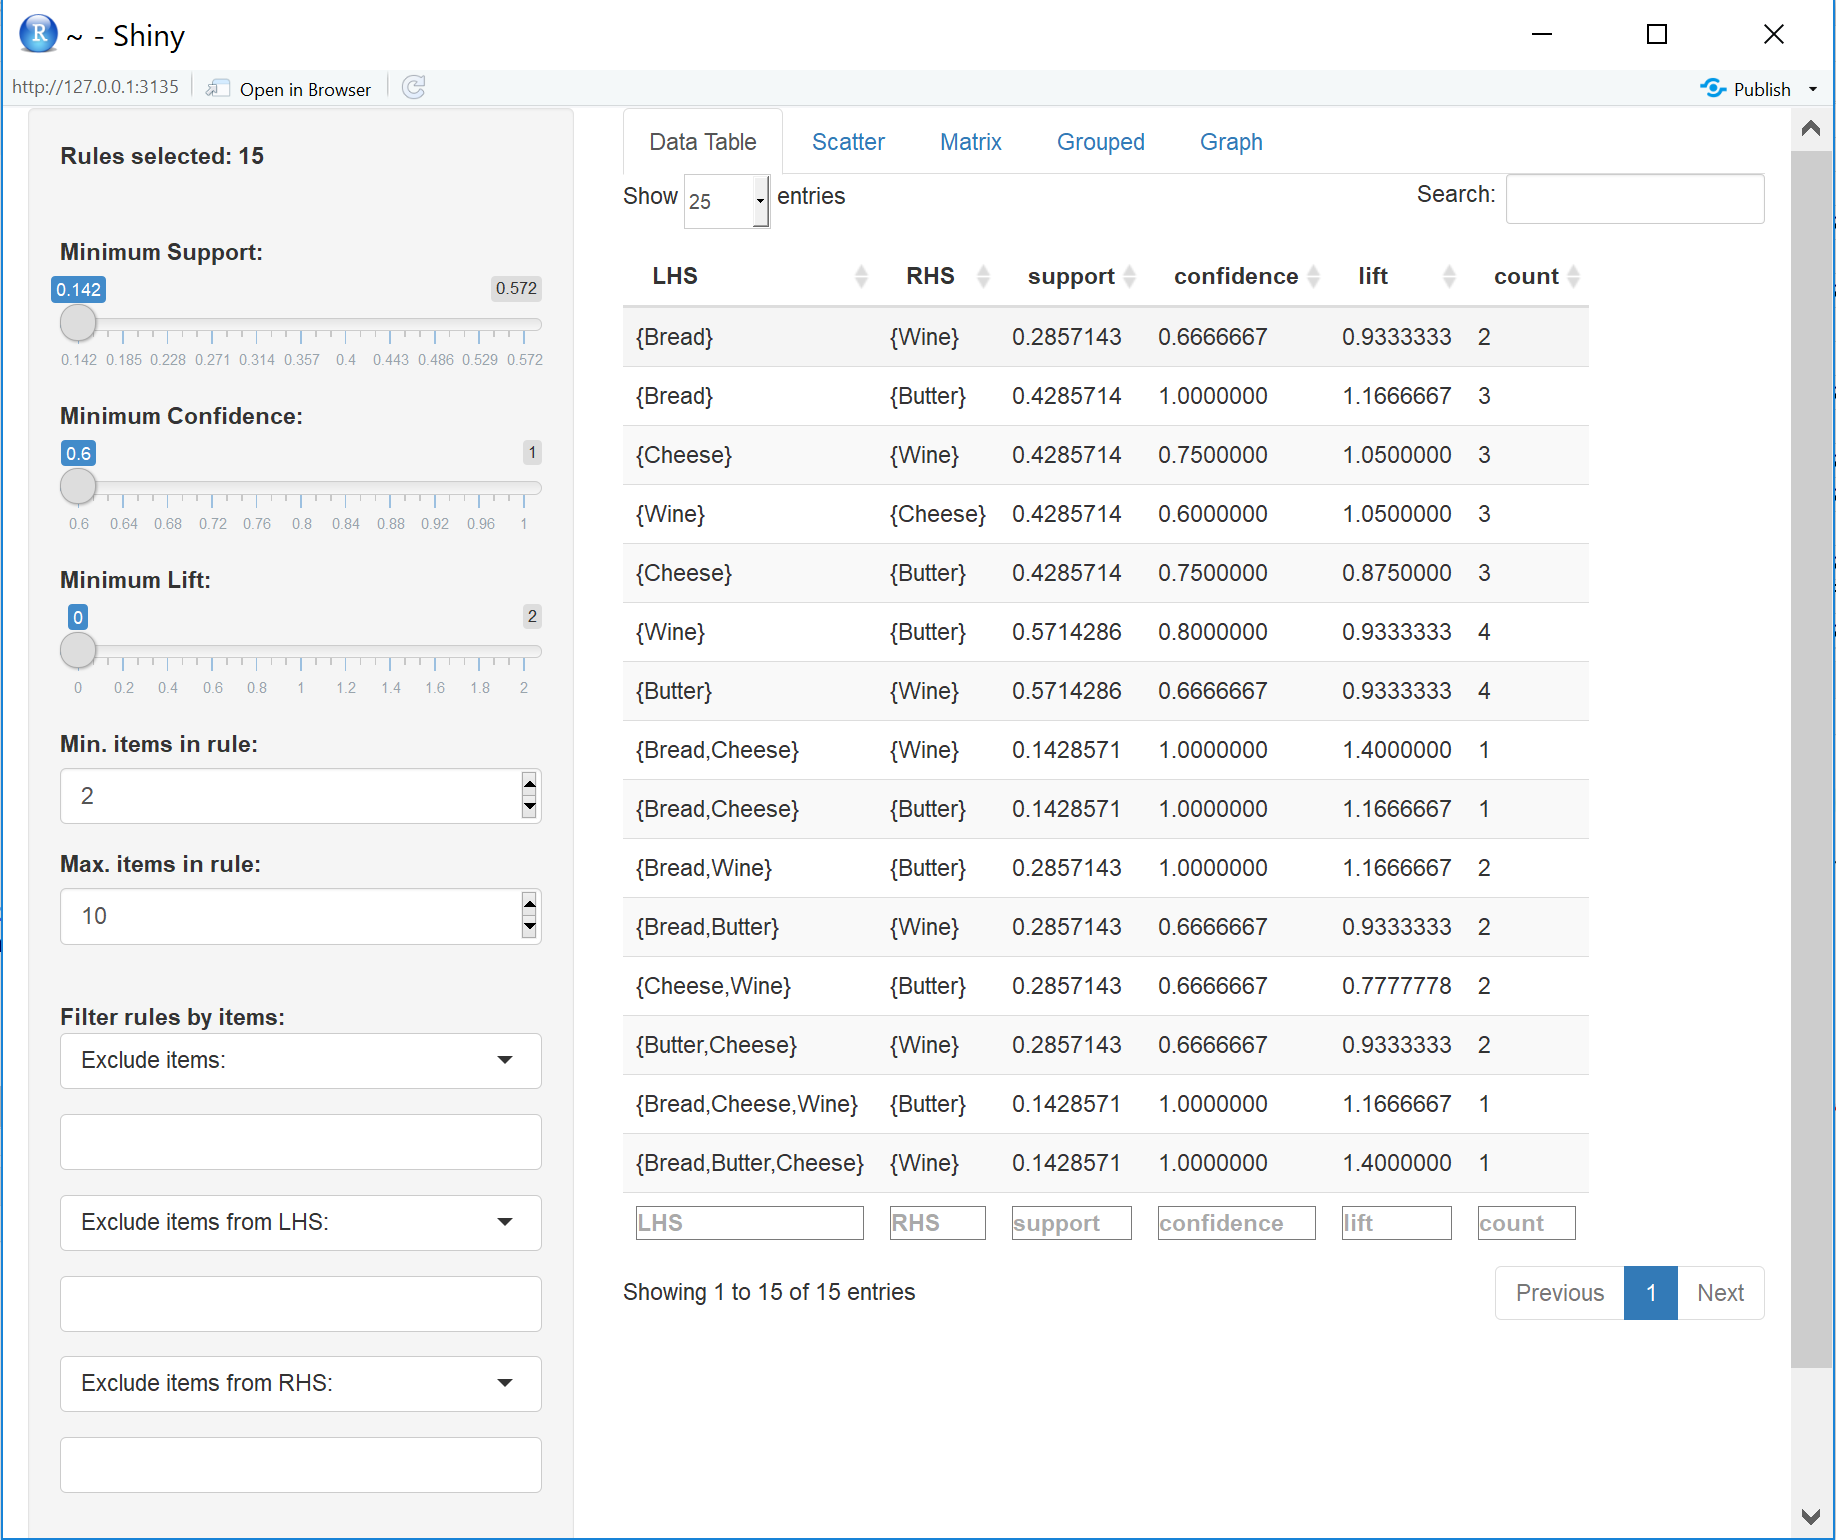
ruleExplorer: the Swiss Army knife
Market Basket Analysis in R
Christopher Bruffaerts
Statistician
Parallel coordinates plot

