Returning values from functions
Introduction to Writing Functions in R

Richie Cotton
Data Evangelist at DataCamp
A simple sum function
simple_sum <- function(x) {if(anyNA(x)) {return(NA)}total <- 0 for(value in x) { total <- total + value } total }
simple_sum(c(0, 1, 3, 6, NA, 7))
NA
Geometrics means again
calc_geometric_mean <- function(x, na.rm = FALSE) {
assert_is_numeric(x)
if(any(is_non_positive(x), na.rm = TRUE)) {
stop("x contains non-positive values, so the geometric mean makes no sense.")
}
na.rm <- coerce_to(use_first(na.rm), "logical")
x %>%
log() %>%
mean(na.rm = na.rm) %>%
exp()
}
Returning NaN with a warning
calc_geometric_mean <- function(x, na.rm = FALSE) { assert_is_numeric(x) if(any(is_non_positive(x), na.rm = TRUE)) {warning("x contains non-positive values, so the geometric mean makes no sense.") return(NaN)} na.rm <- coerce_to(use_first(na.rm), "logical") x %>% log() %>% mean(na.rm = na.rm) %>% exp() }
Reasons for returning early
- You already know the answer.
- The input is an edge case.
Hiding the return value
simple_sum <- function(x) {

  if(anyNA(x)) {

    return(NA)

  }

  total <- 0
  for(value in x) {
    total <- total + value
  }
  total
}
simple_sum(c(0, 1, 3, 6, 2, 7))
19
Hiding the return value
simple_sum <- function(x) { if(anyNA(x)) { return(NA) } total <- 0 for(value in x) { total <- total + value }invisible(total)}
simple_sum(c(0, 1, 3, 6, 2, 7))
Many plots invisibly return things
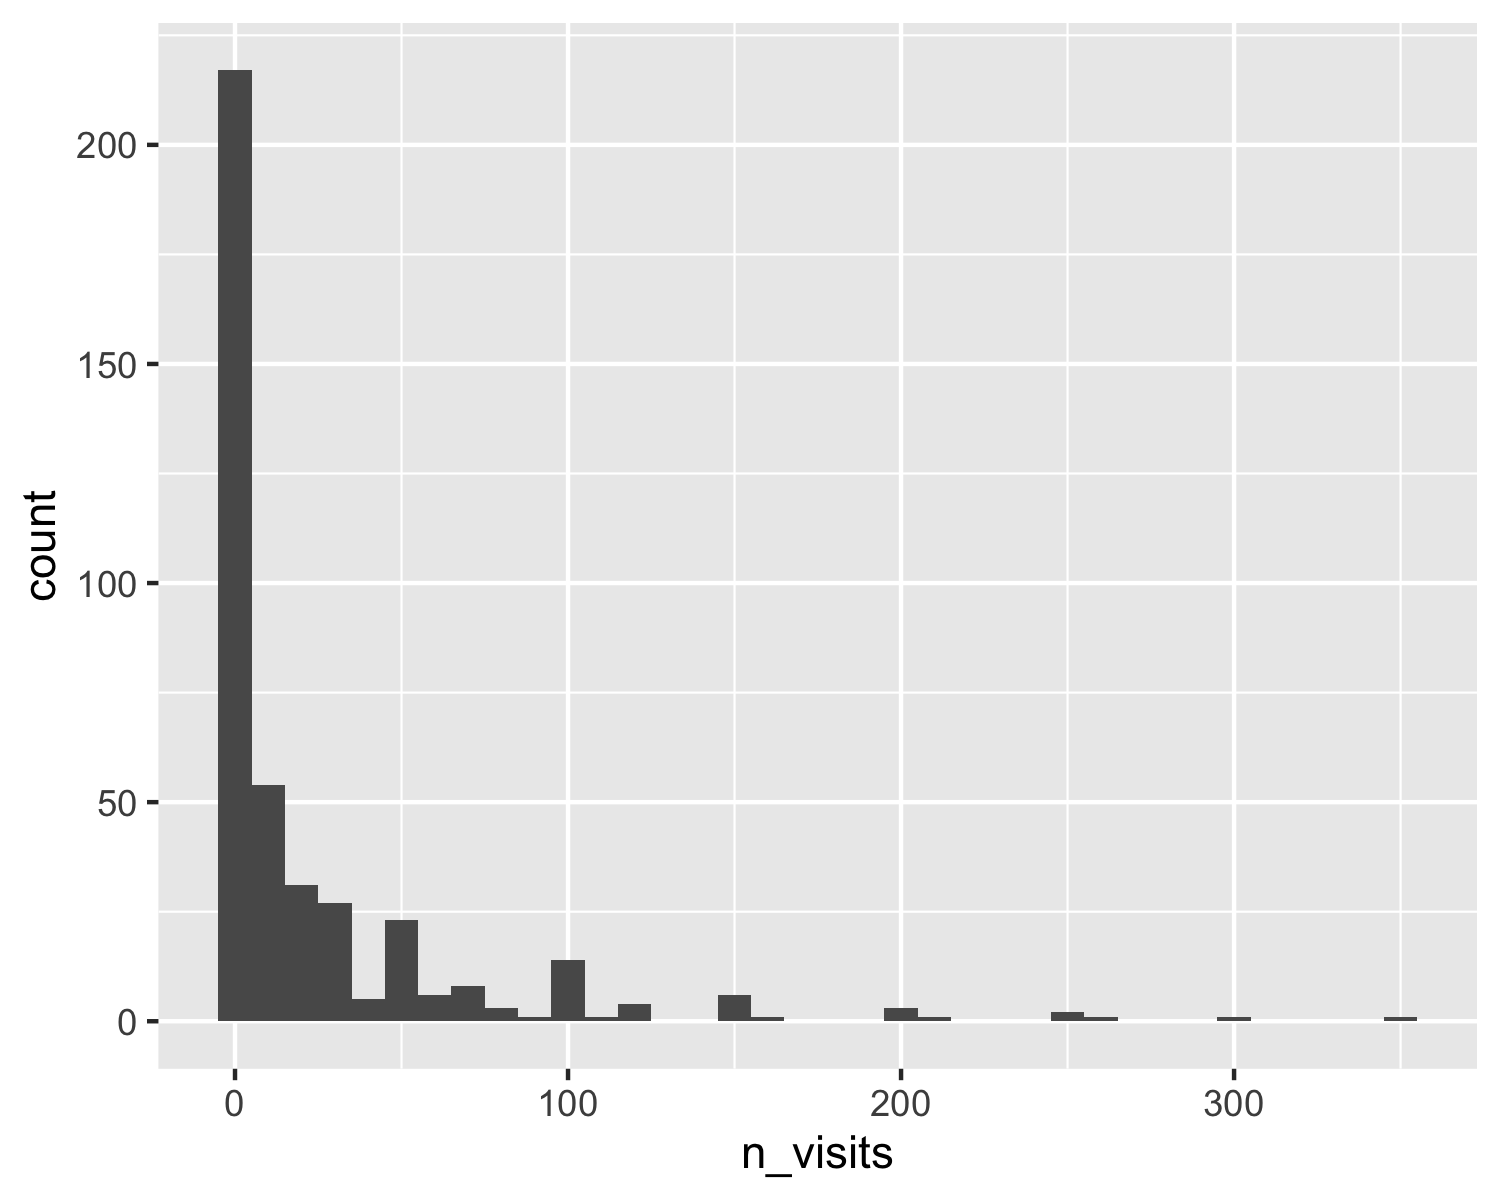
ggplot(snake_river_visits, aes(n_visits)) +
  geom_histogram(binwidth = 10)

Many plots invisibly return things
srv_hist <- ggplot(snake_river_visits, aes(n_visits)) +
  geom_histogram(binwidth = 10)
str(srv_hist, max.level = 0)
List of 9
 - attr(*, "class")= chr [1:2] "gg" "ggplot"

Let's practice!
Introduction to Writing Functions in R

