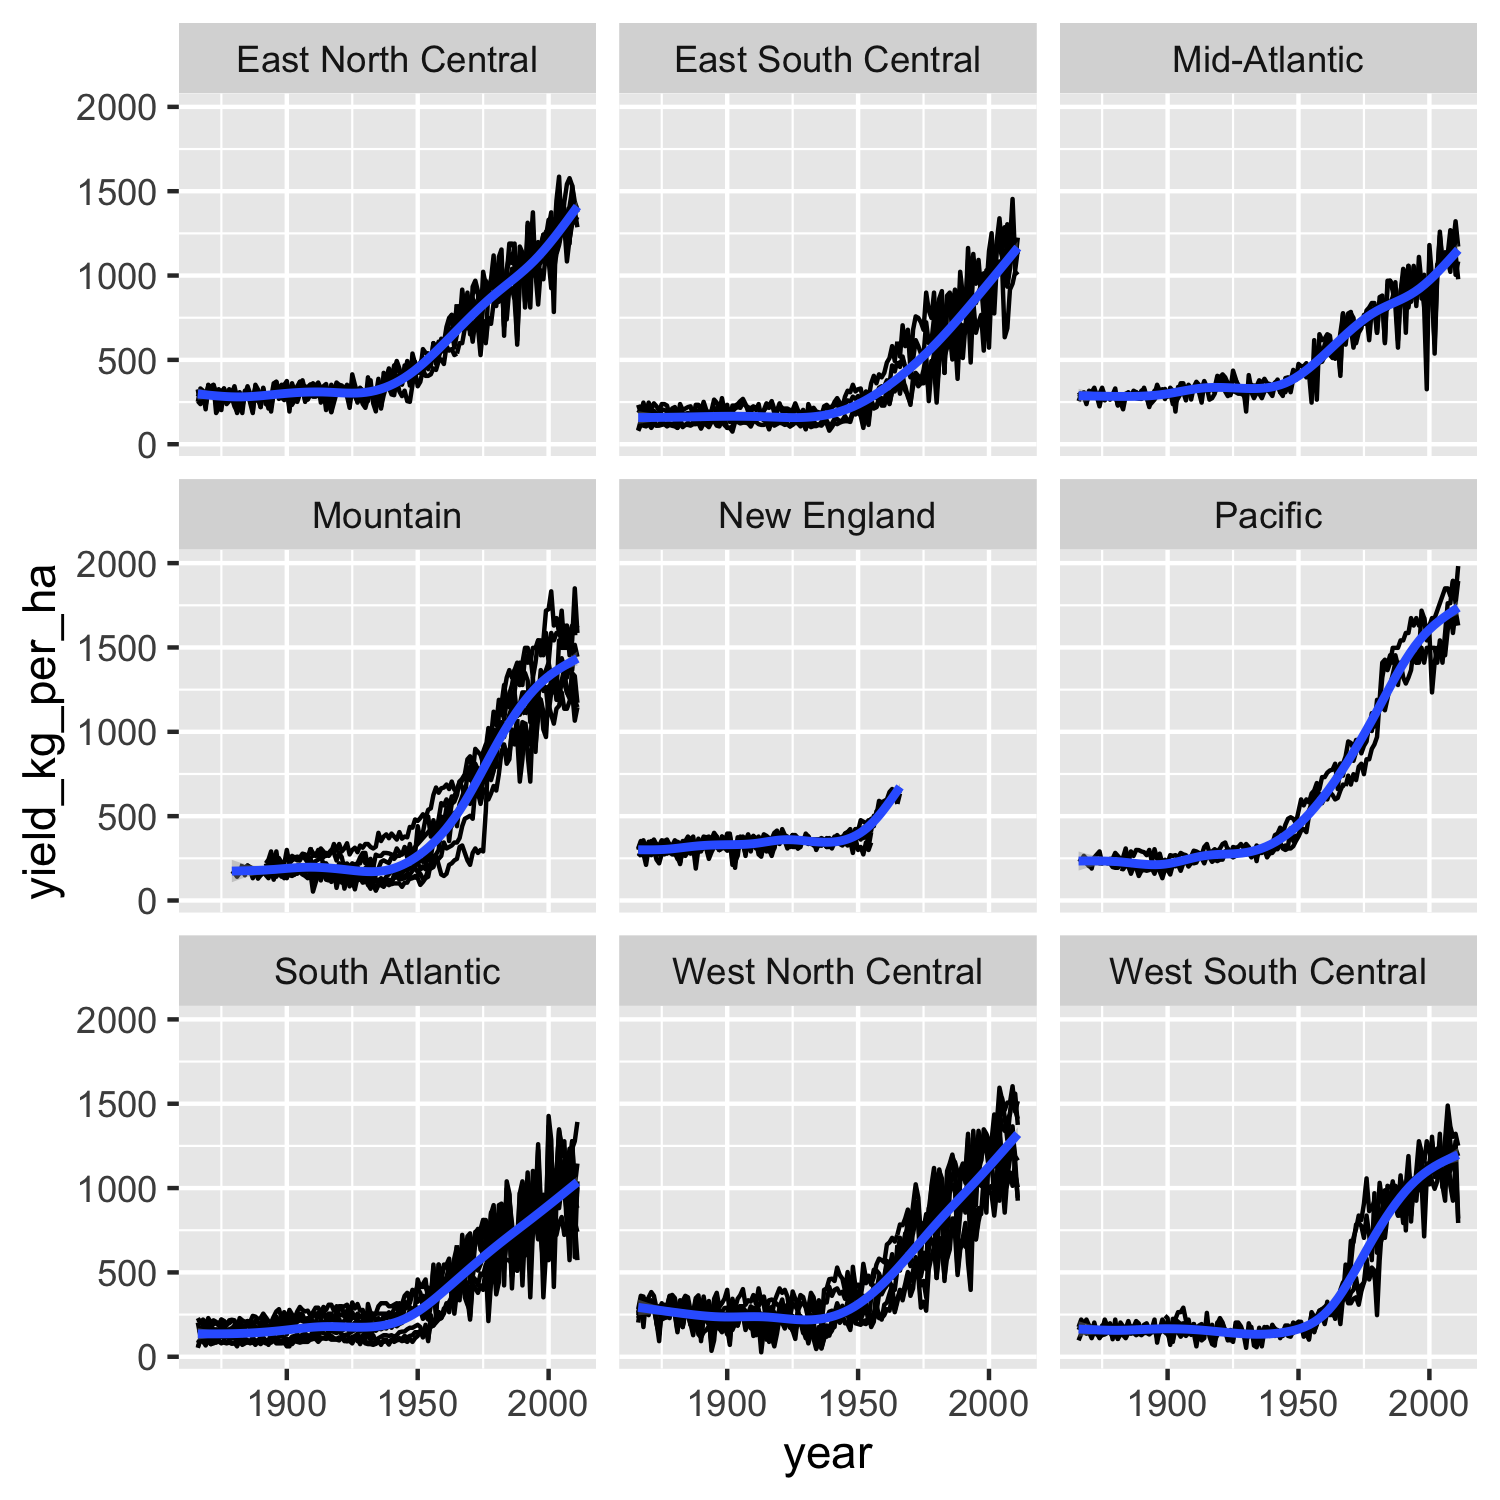
Modeling grain yields
Introduction to Writing Functions in R

Richie Cotton
Data Evangelist at DataCamp

Linear models vs. generalized additive models
A linear model
lm(
  response_var ~ explanatory_var1 + explanatory_var2,
  data = dataset
)
A generalized additive model
library(mgcv)
gam(
  response_var ~ s(explanatory_var1) + explanatory_var2,
  data = dataset
)
Predicting GAMs
predict_this <- data.frame(
  explanatory_var1 = c("some", "values"),
  explanatory_var2 = c("more", "values")
)
predicted_responses <- predict(model, predict_this, type = "response")
predict_this %>%
  mutate(predicted_responses = predicted_responses)
Let's practice!
Introduction to Writing Functions in R

