Parlor trick or worthwhile?
Sentiment Analysis in R

Ted Kwartler
Data Dude
Interesting visuals
Good Visuals
- Simple to interpret
- Confirm or elucidate data aspects
- Context for the audience
- Appropriate type e.g. line charts for time, bars for amounts
Bonus:
- Avoid word clouds
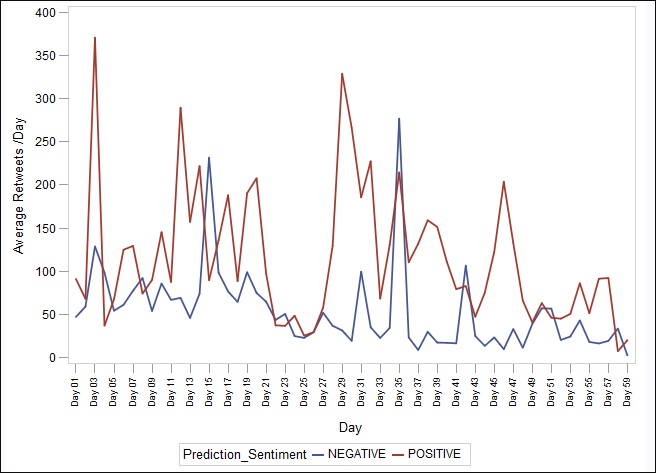
Tracking sentiment over time
Sentiment timeline - a way of displaying sentiment values in chronological order. It is typically a graphic design showing time periods, such as months, as the X axis and the sentiment values as Y axis values either as a line or series of bars.

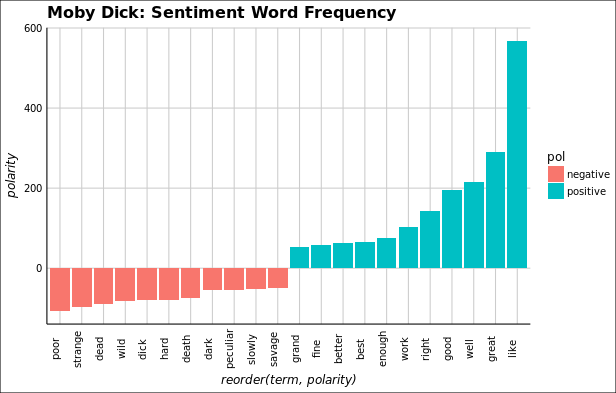
Simple frequency analysis

ggplot2 is a popular library based on the "grammar of graphics" for constructing visuals in R.
Let's practice!
Sentiment Analysis in R

