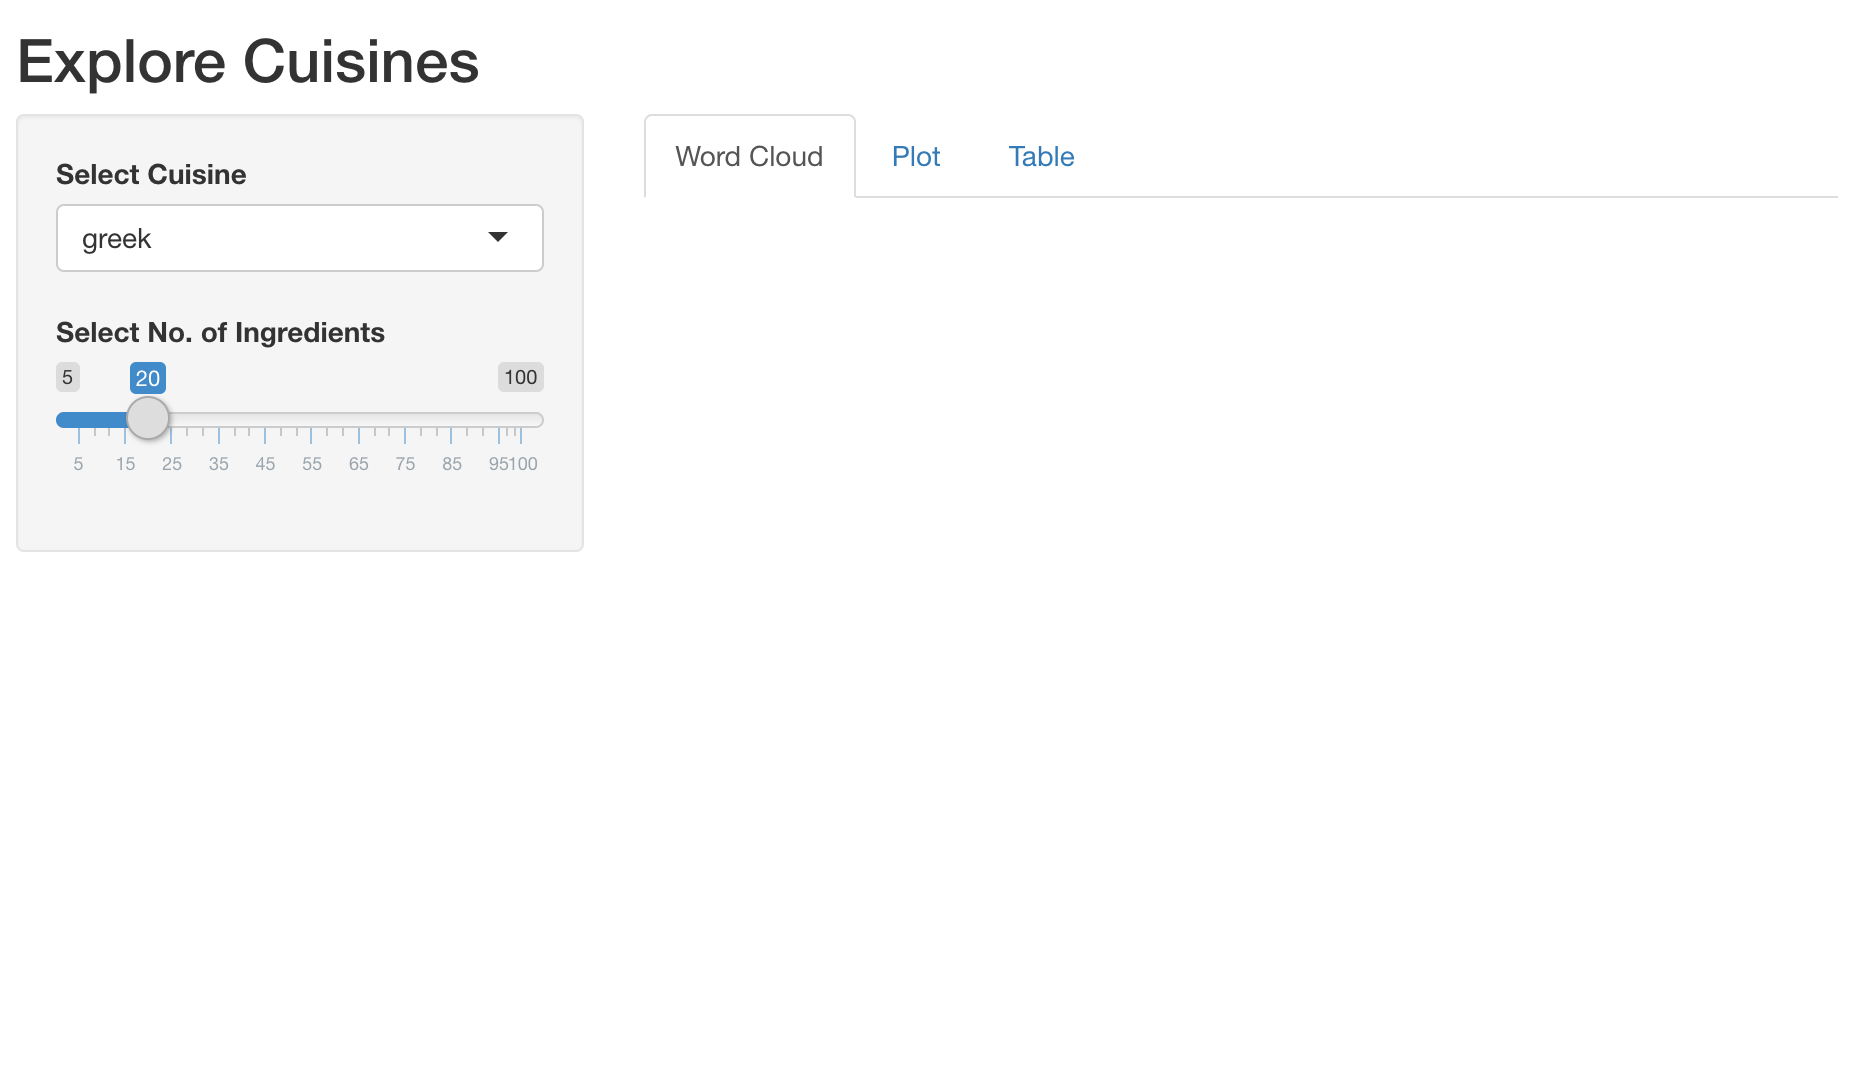
Explore cuisines
Building Web Applications with Shiny in R

Ramnath Vaidyanathan
VP of Product Research
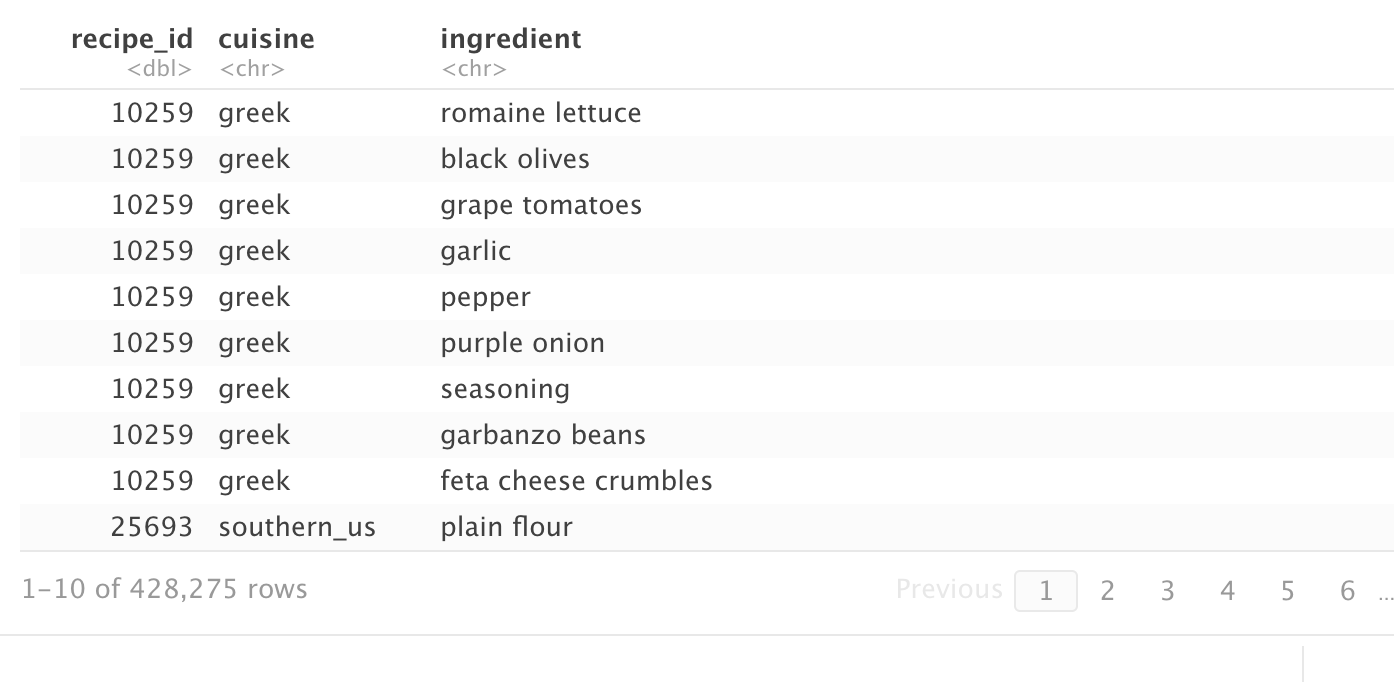
Explore data
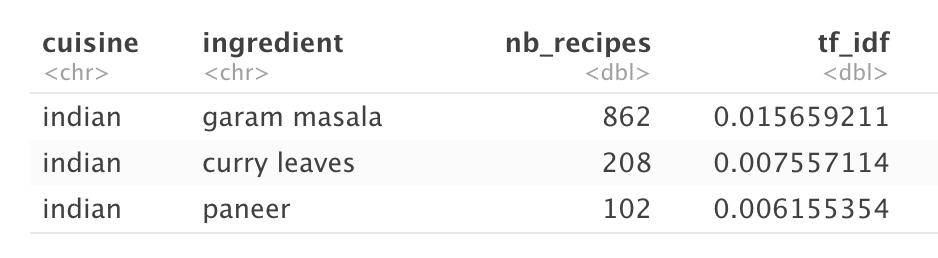
Compute TFIDF
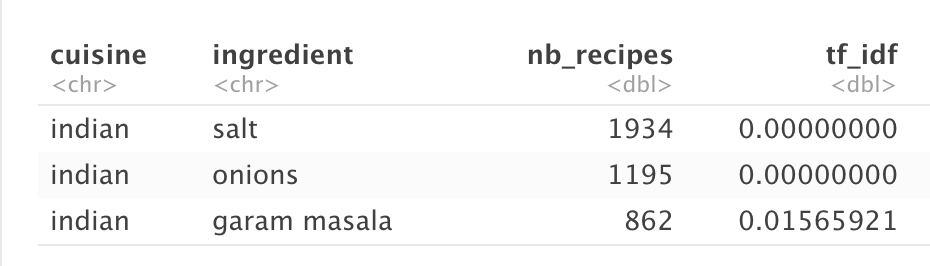
recipes_enriched <- recipes %>%count(cuisine, ingredient, name = 'nb_recipes') %>%tidytext::bind_tf_idf(ingredient, cuisine, nb_recipes)