Layouts and themes
Building Web Applications with Shiny in R

Kaelen Medeiros
Data Scientist
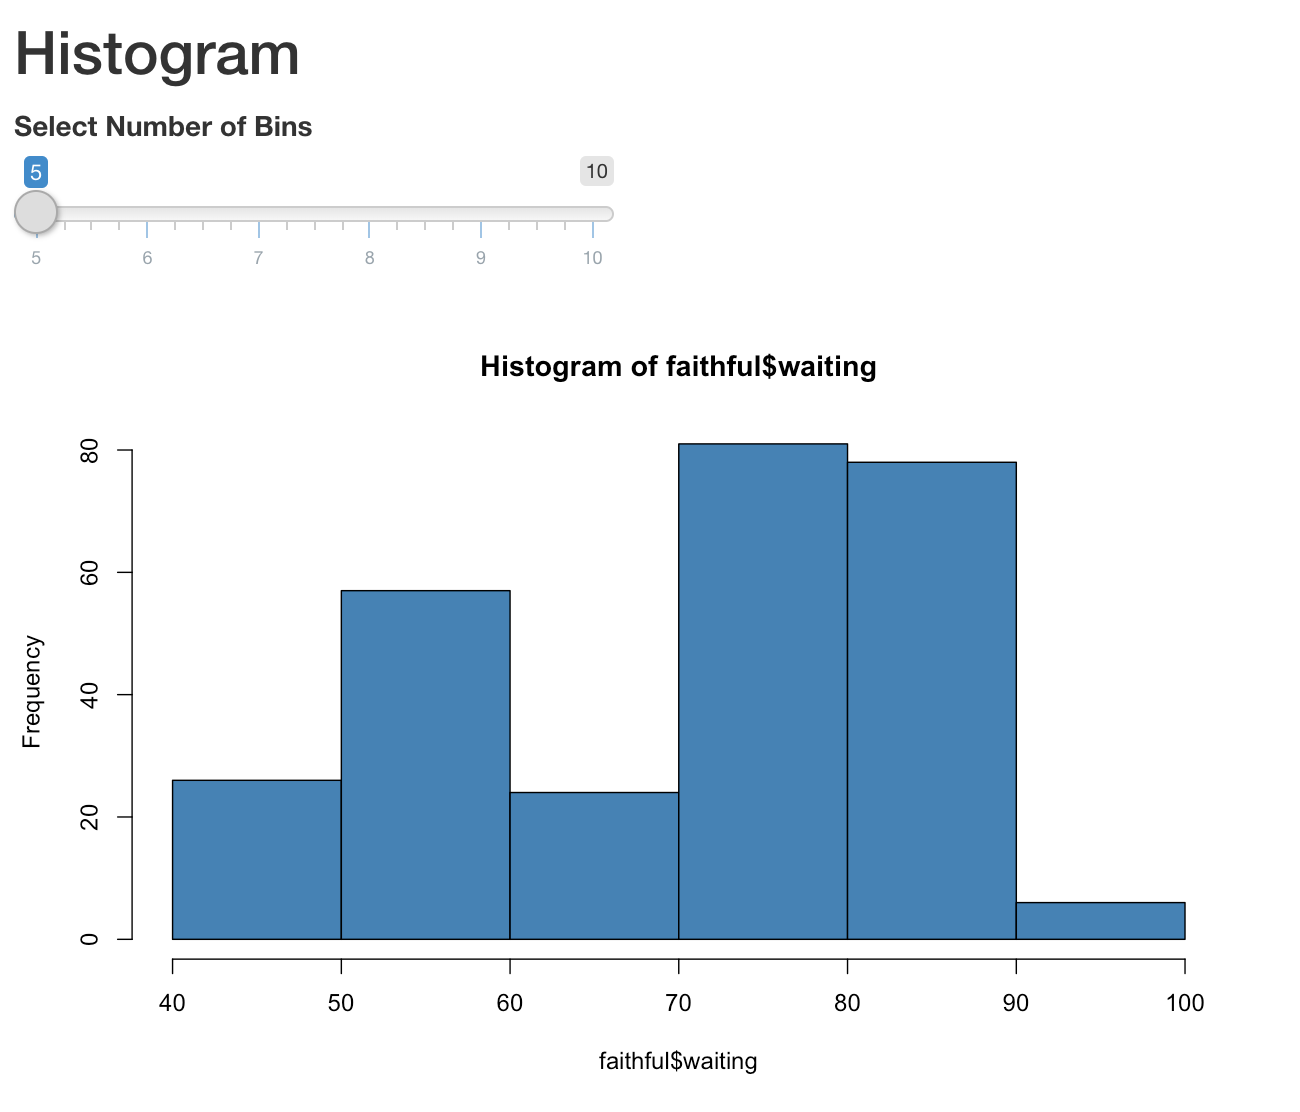
Default Shiny app layout
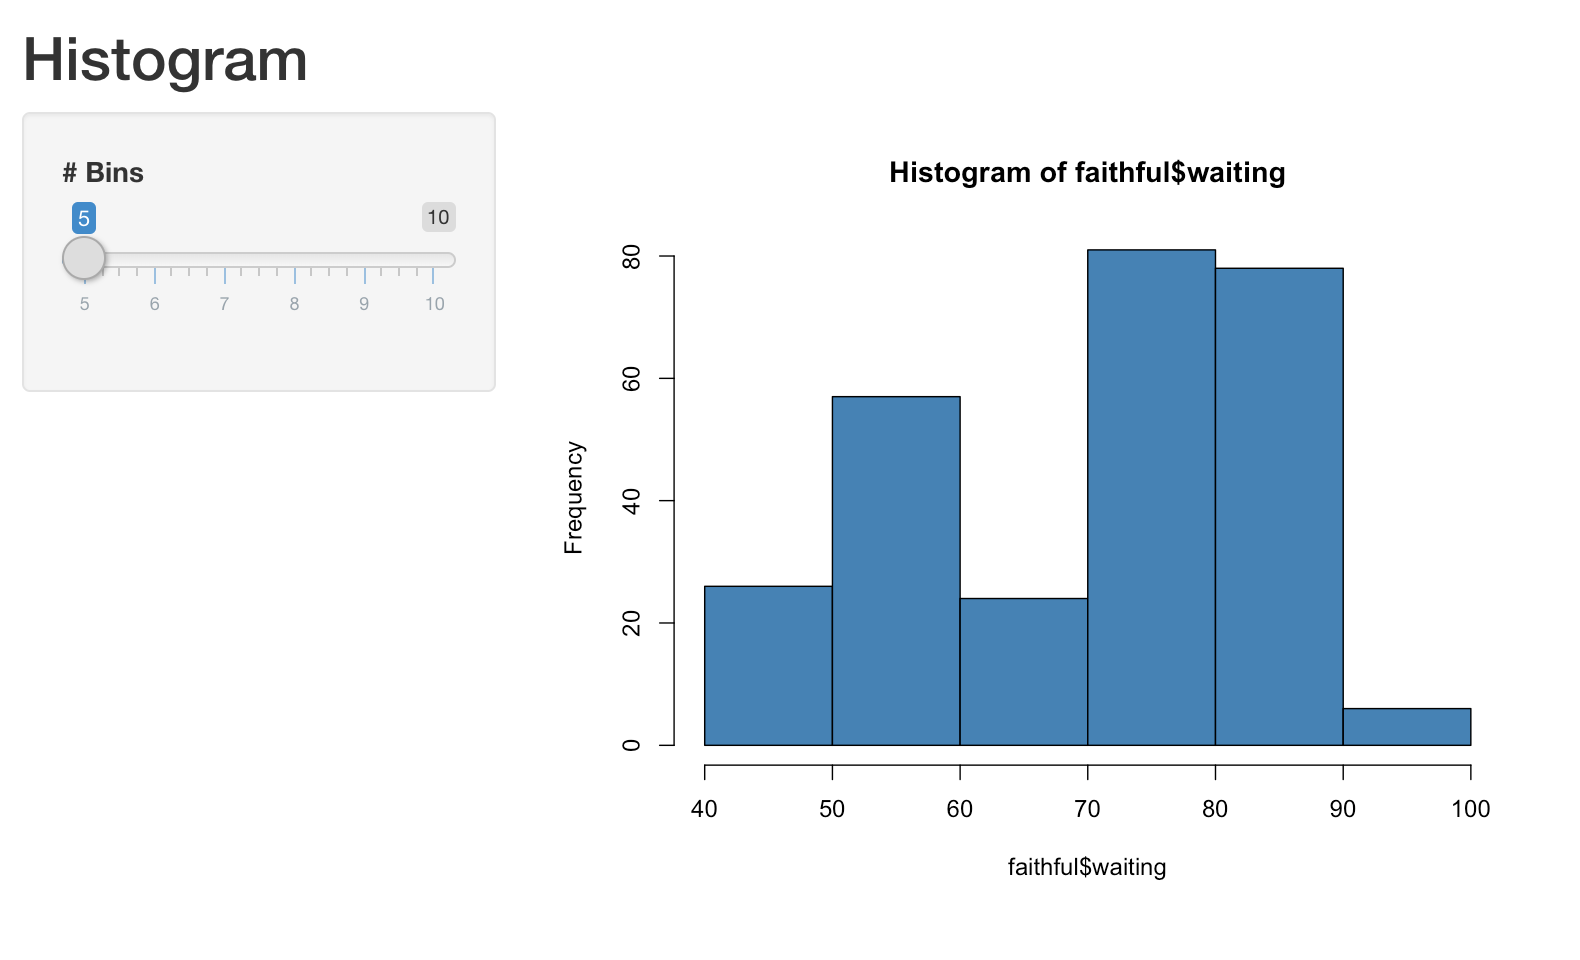
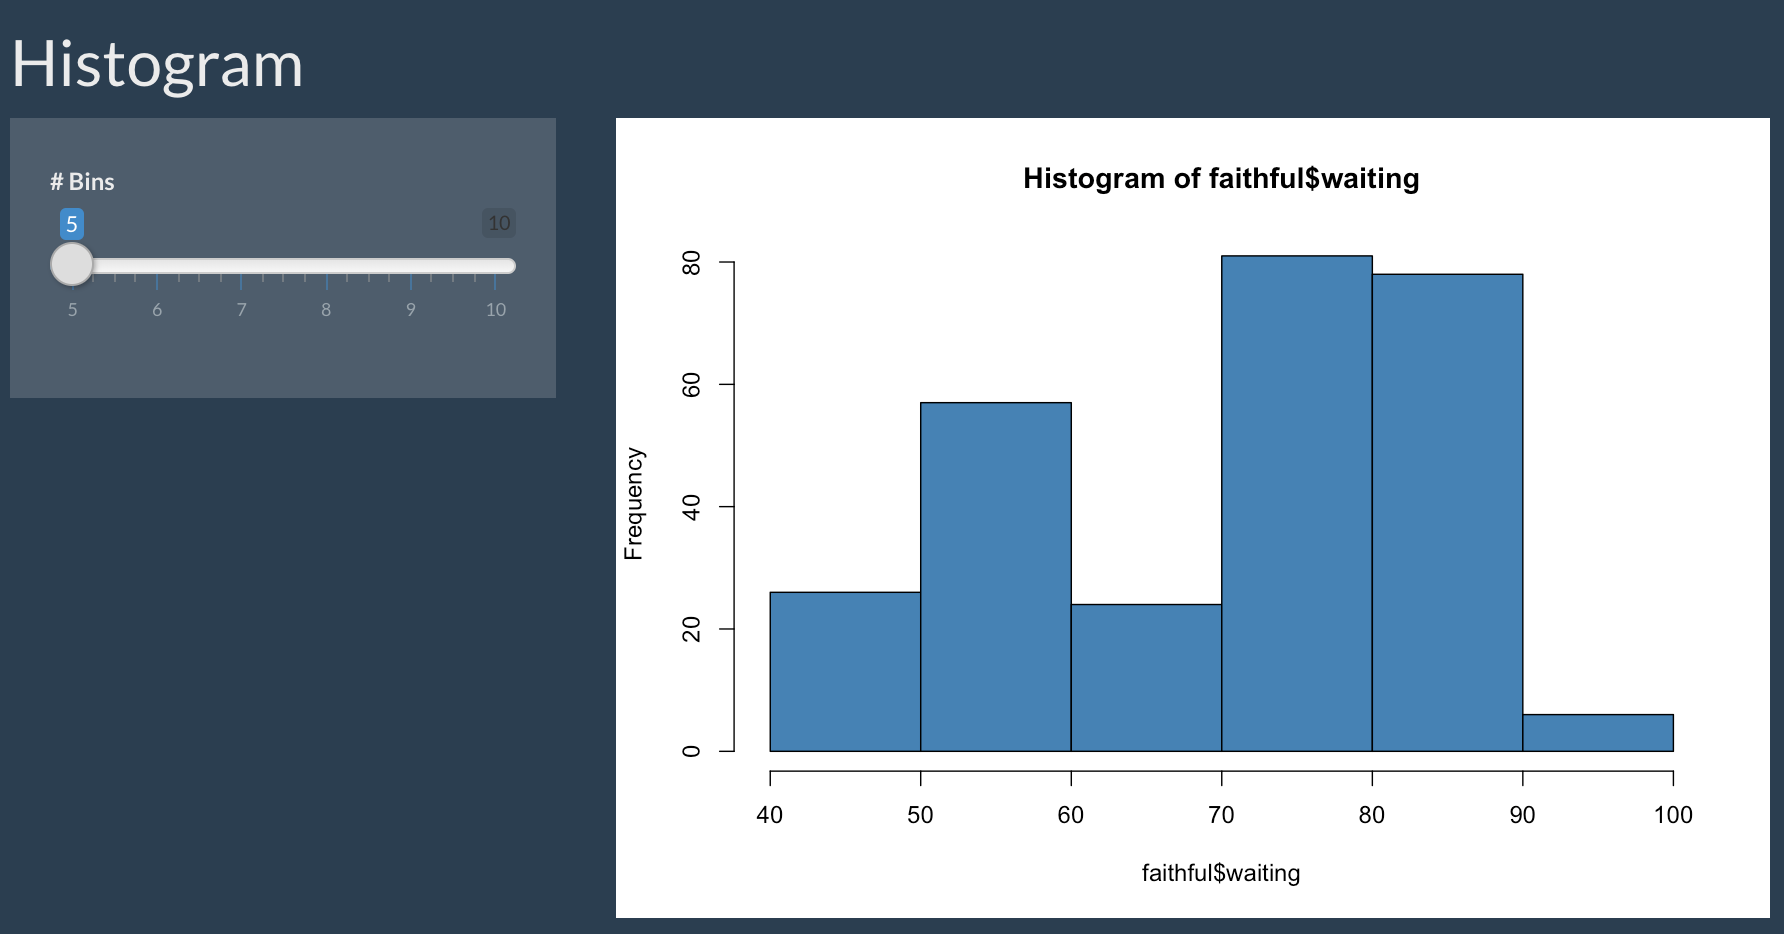
Sidebar layout
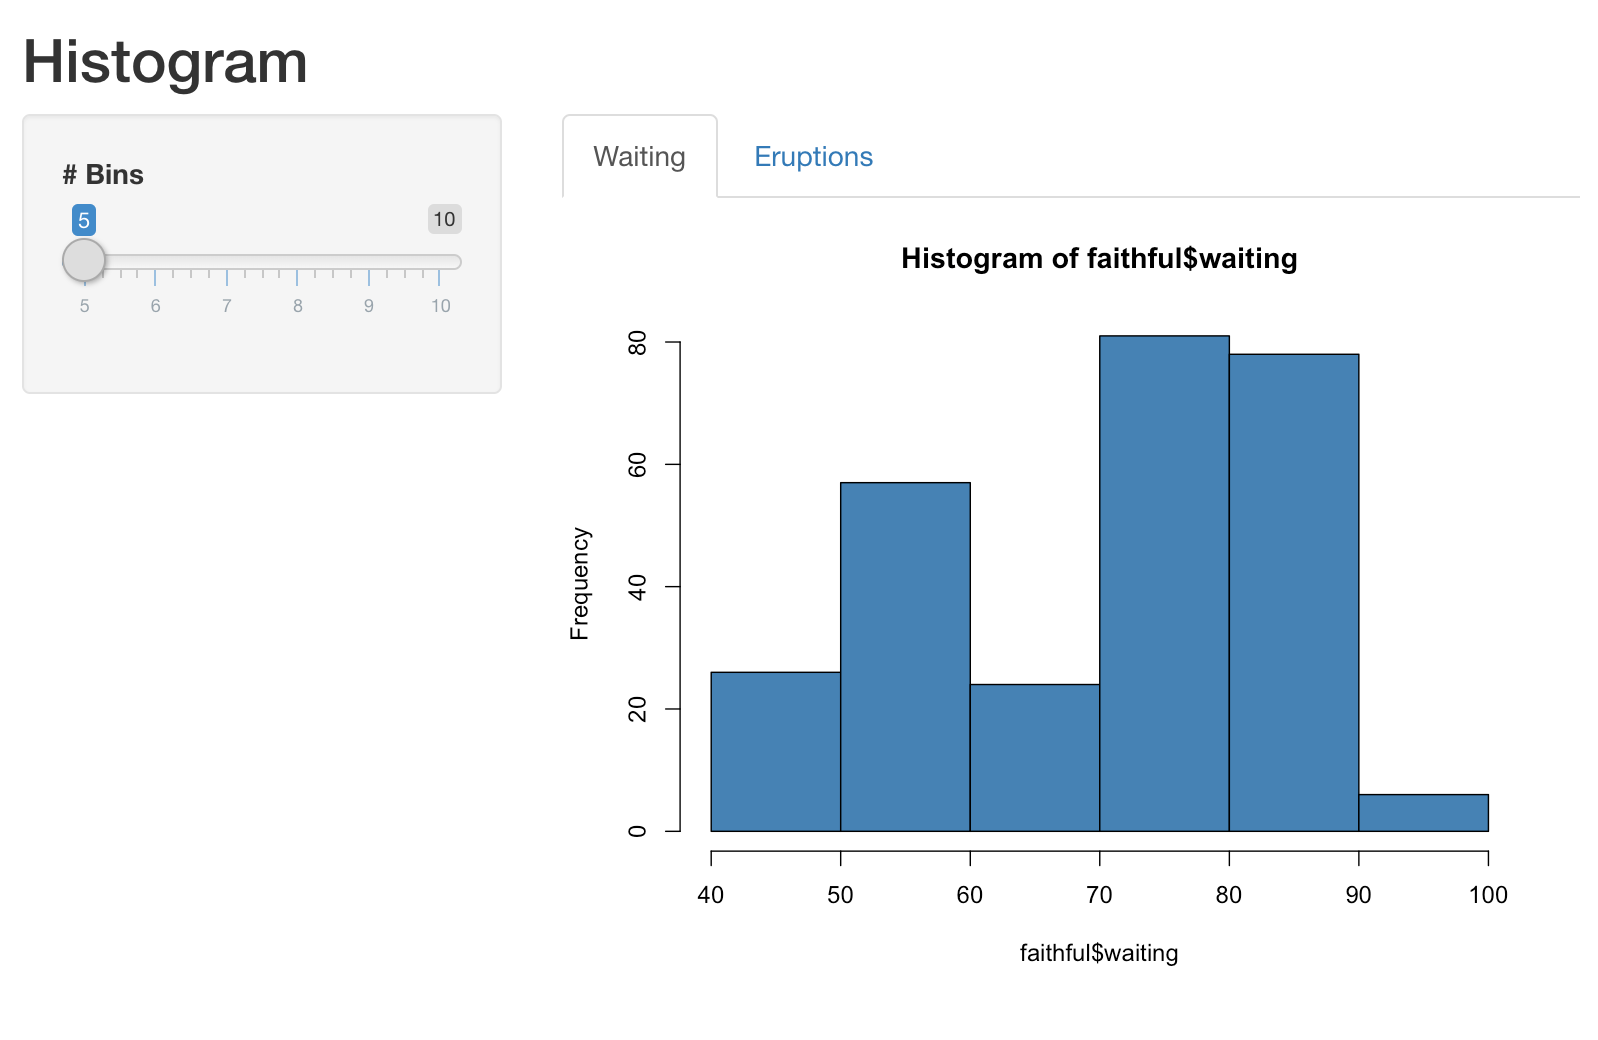
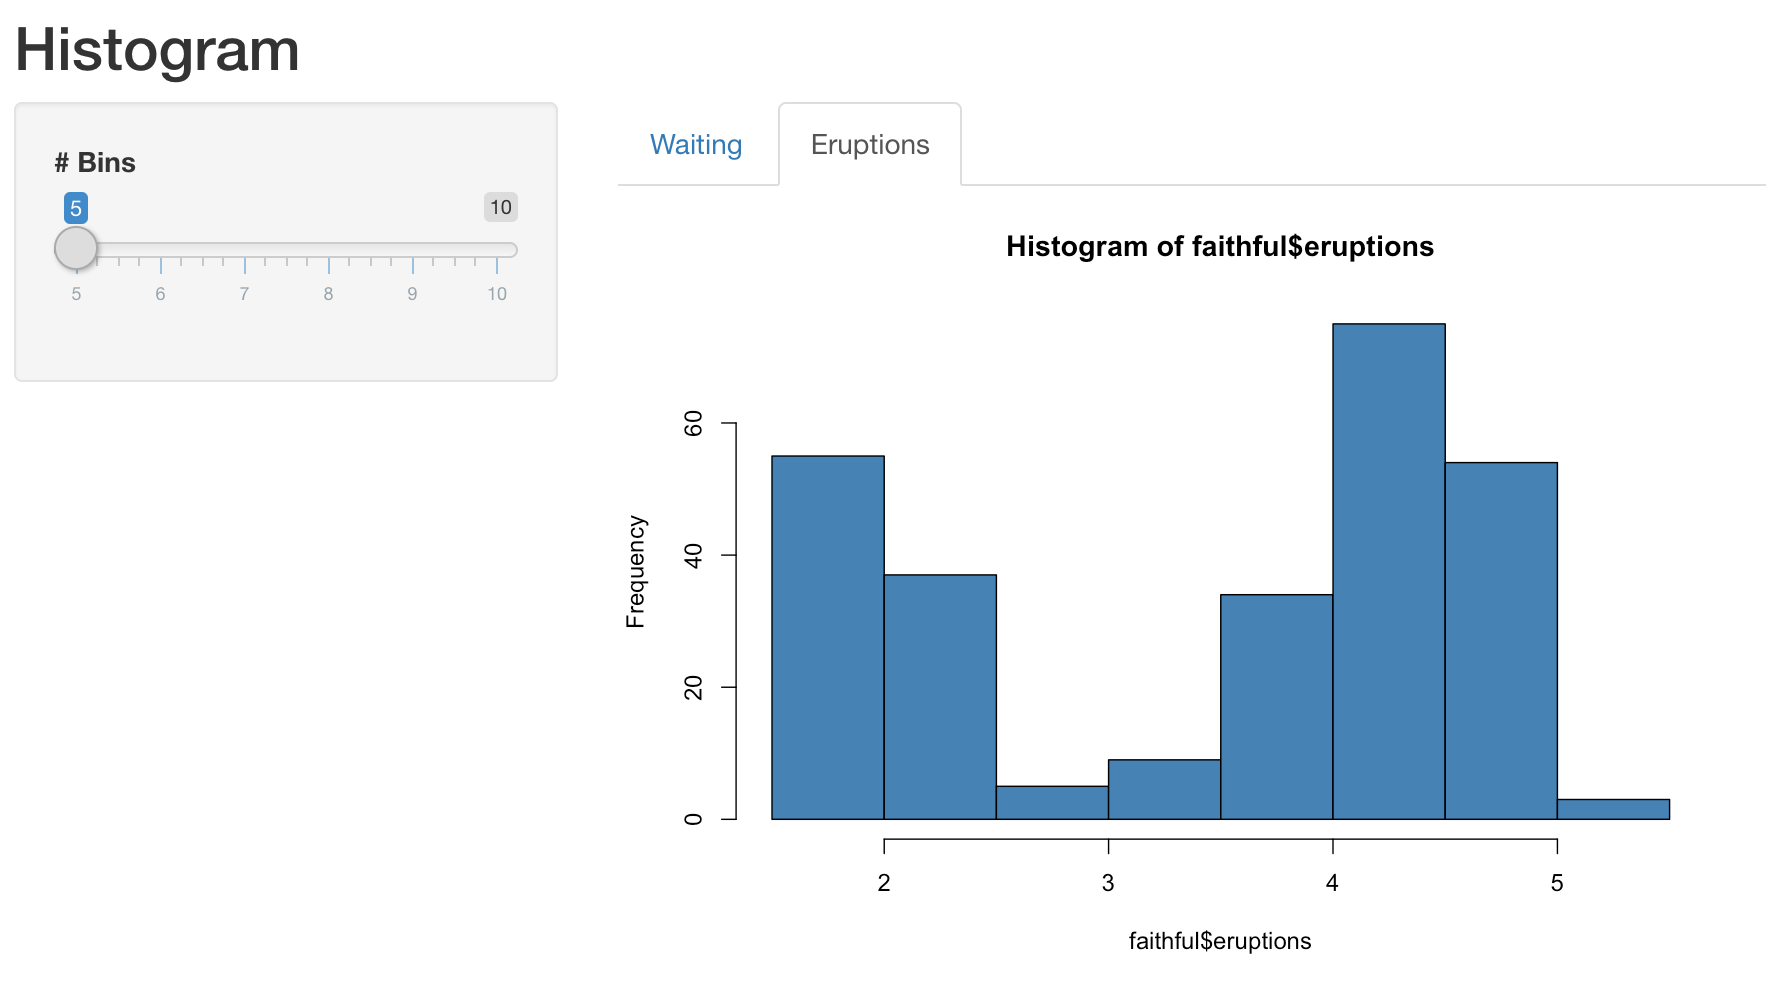
Tab layout
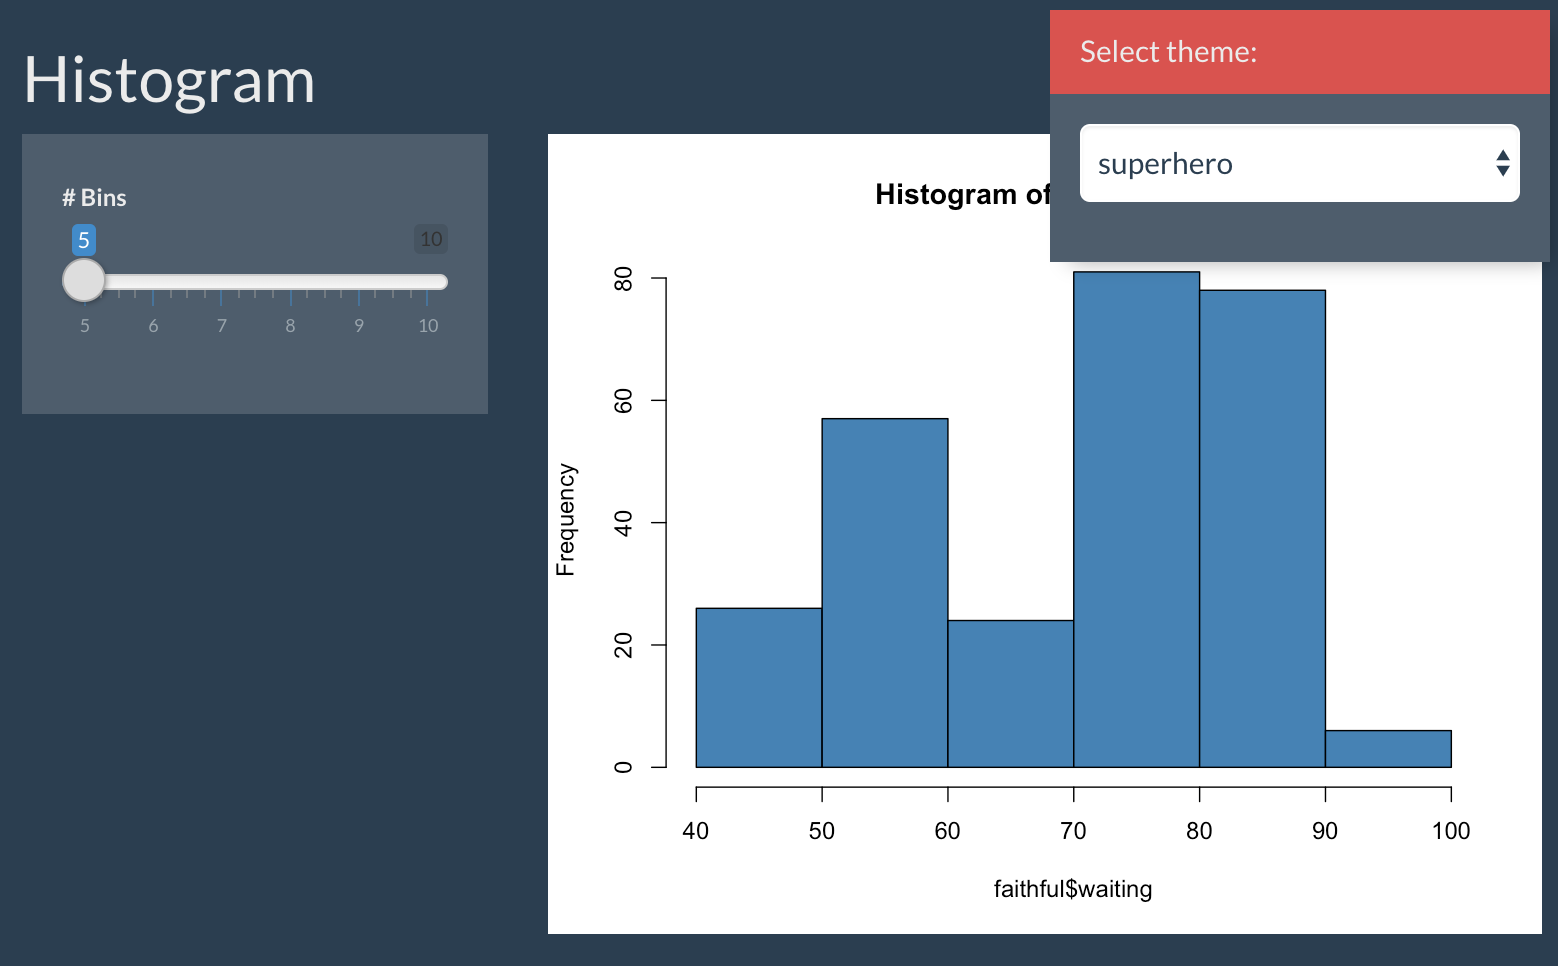
Theme selector
Adding a theme
Building Web Applications with Shiny in R
Kaelen Medeiros
Data Scientist

