Building apps
Building Web Applications with Shiny in R

Kaelen Medeiros
Data Scientist
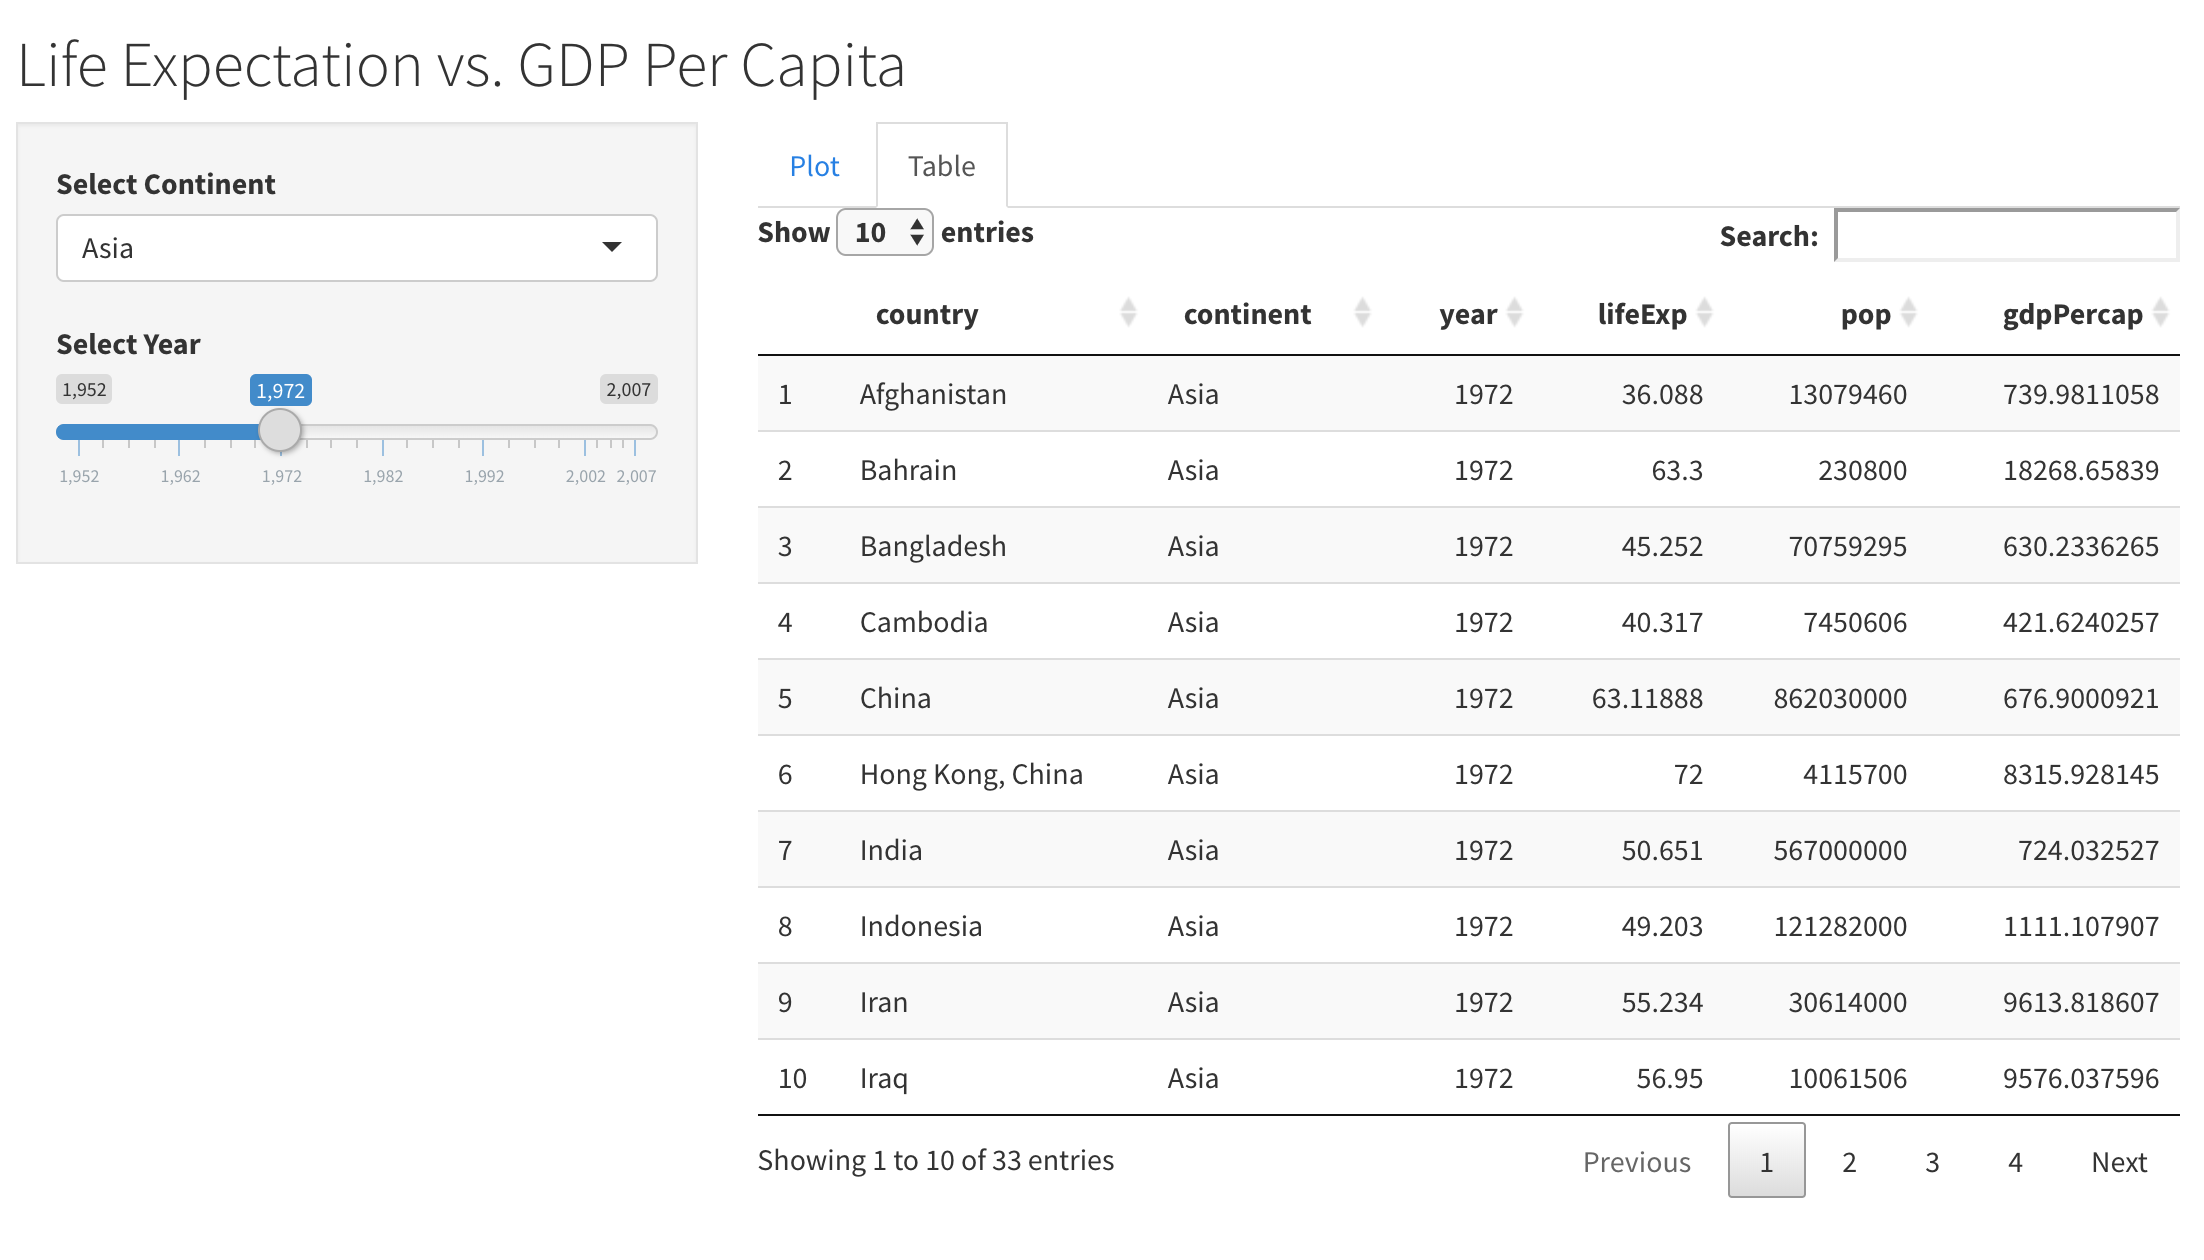
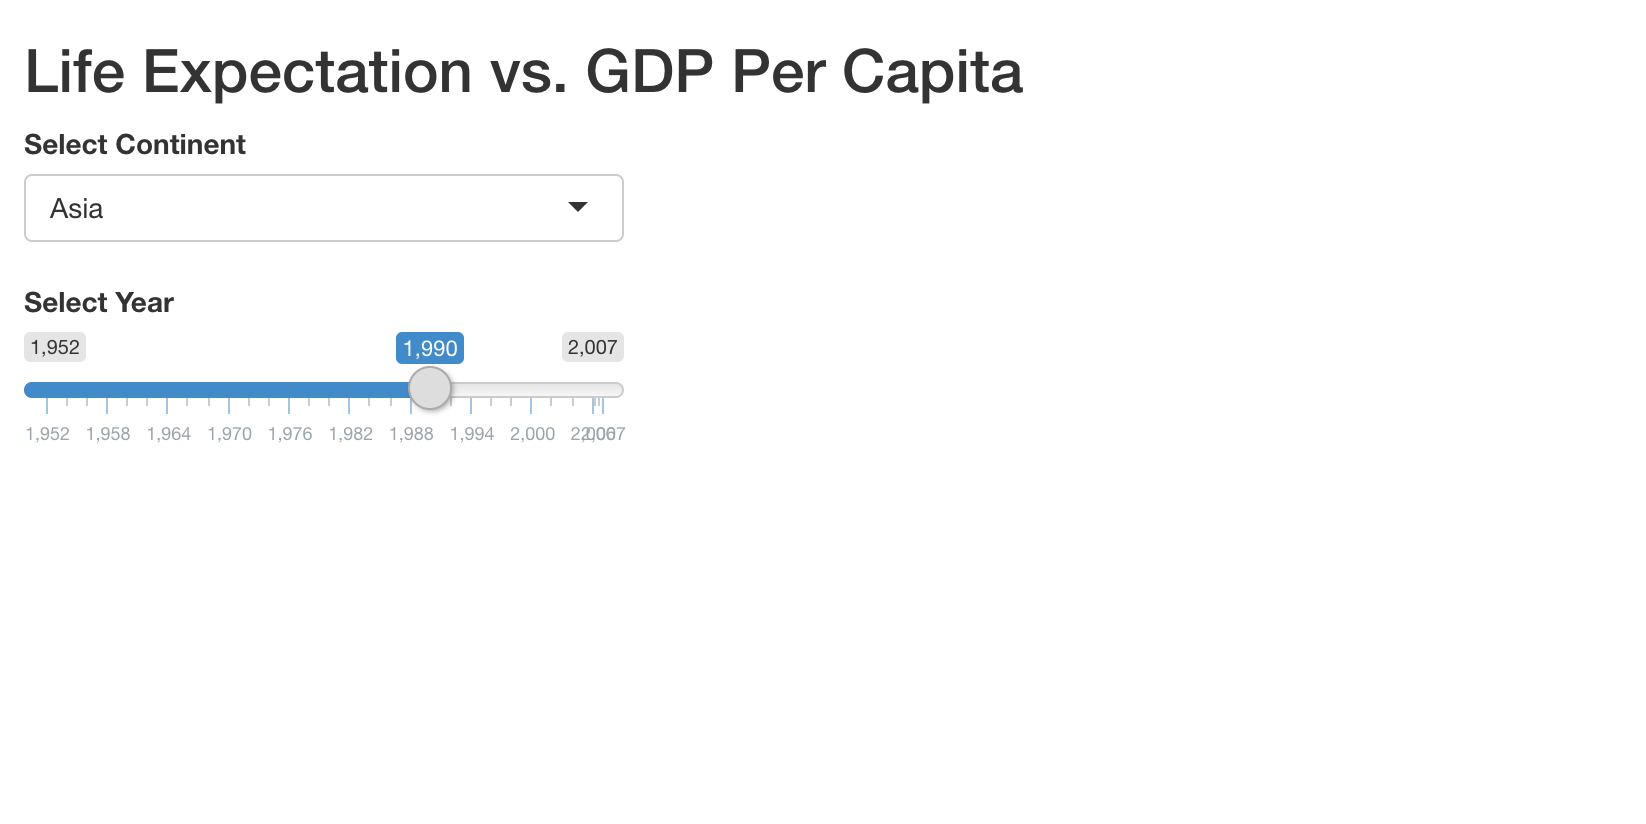
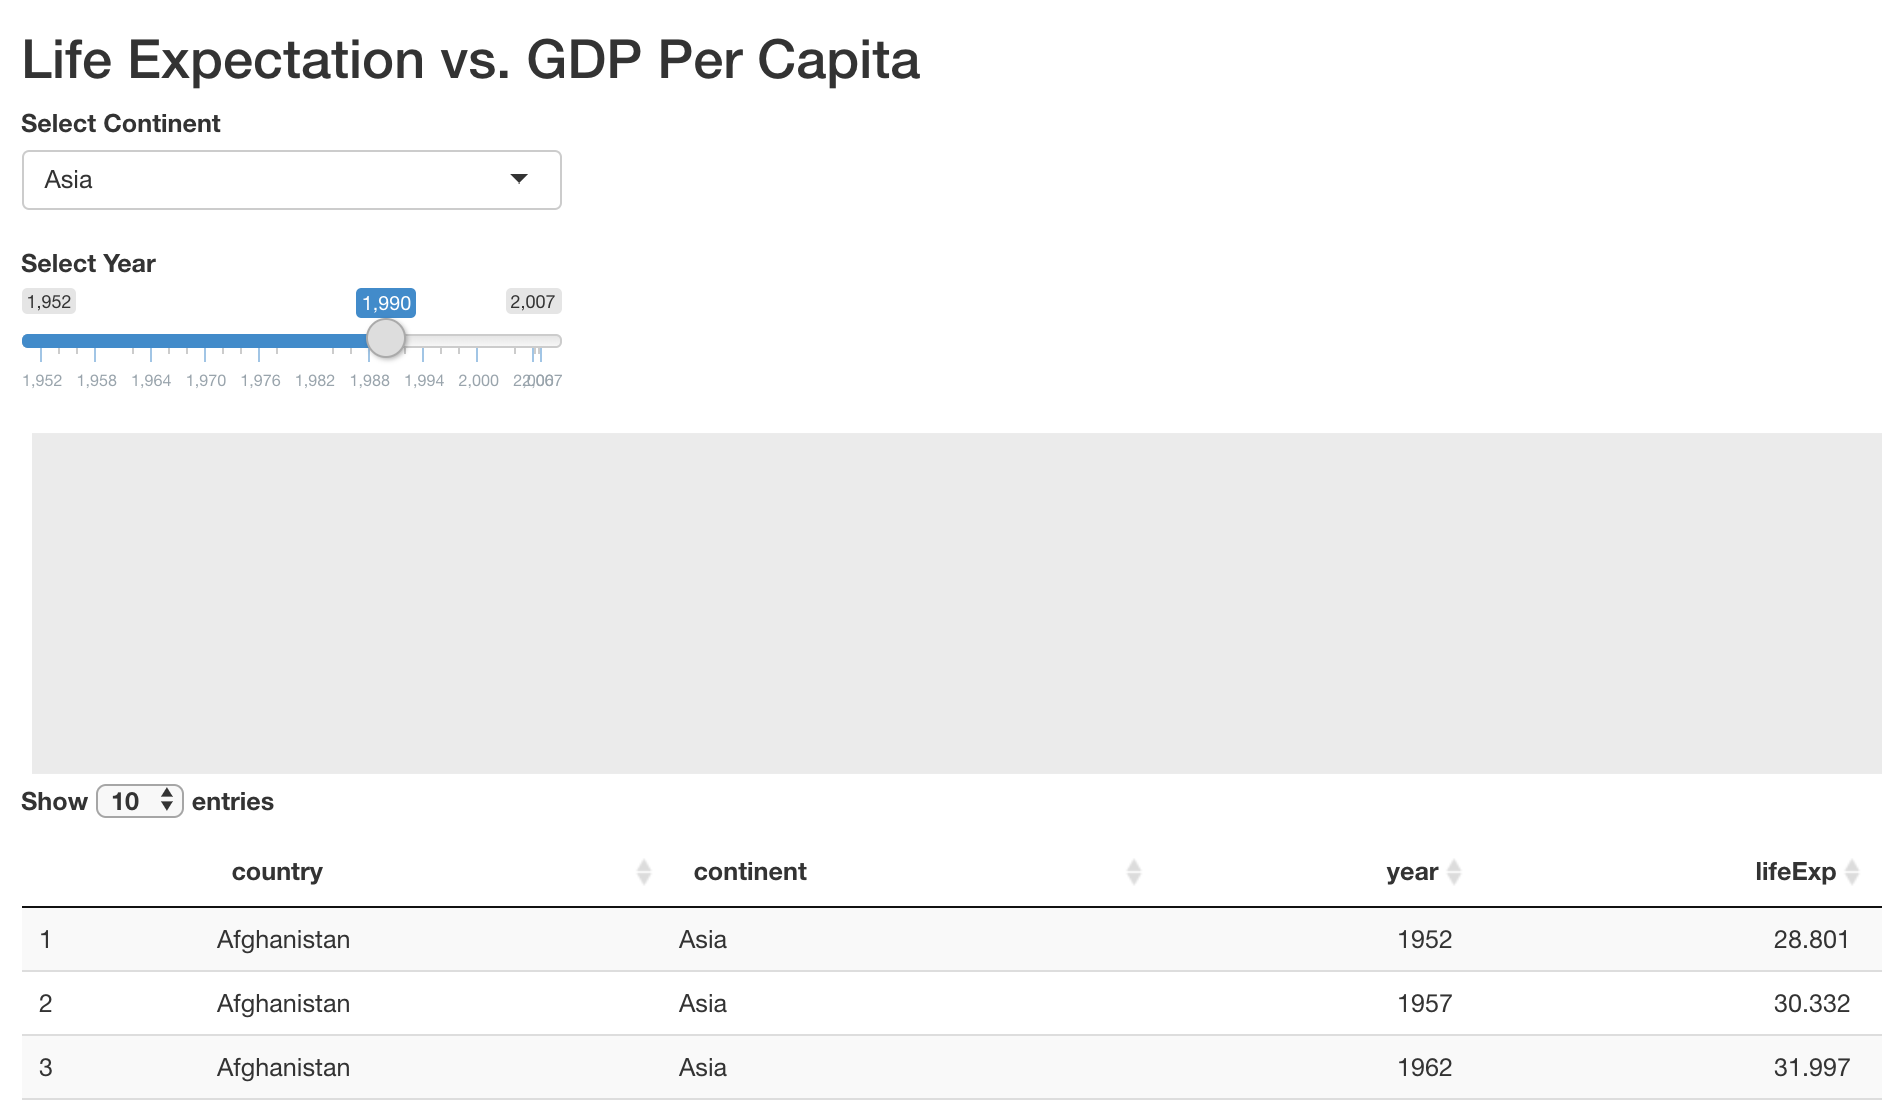
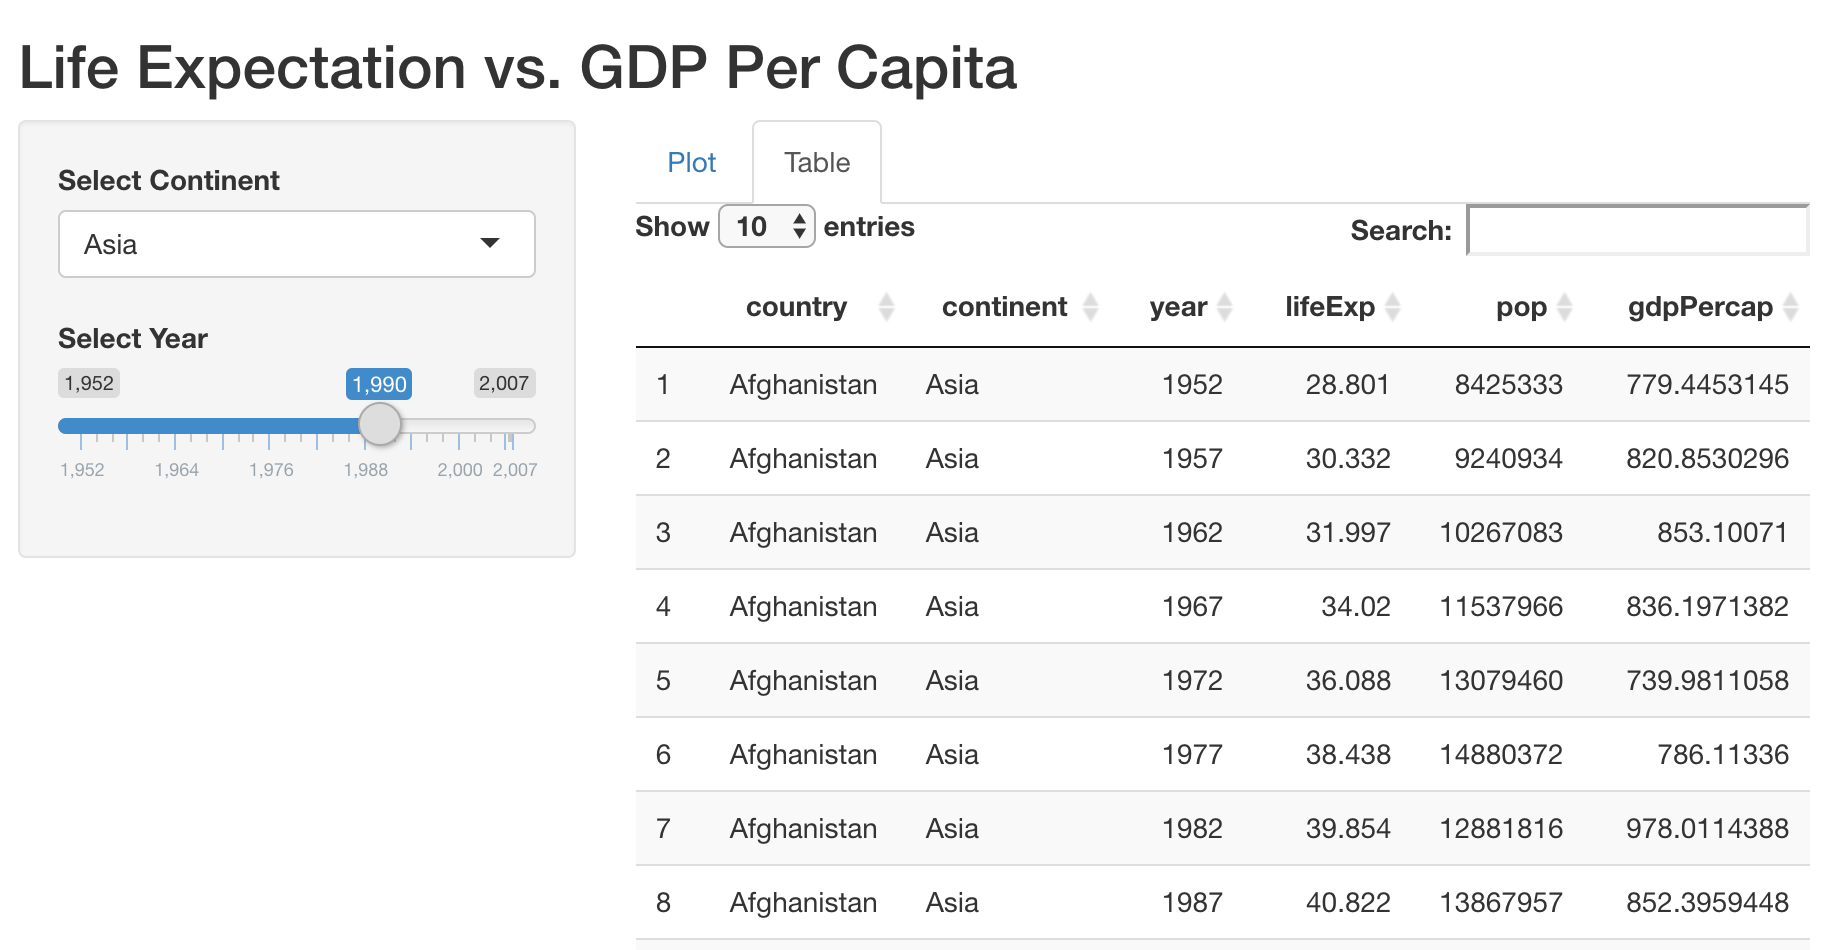
Explore Life Expectation vs. GDP per Capita
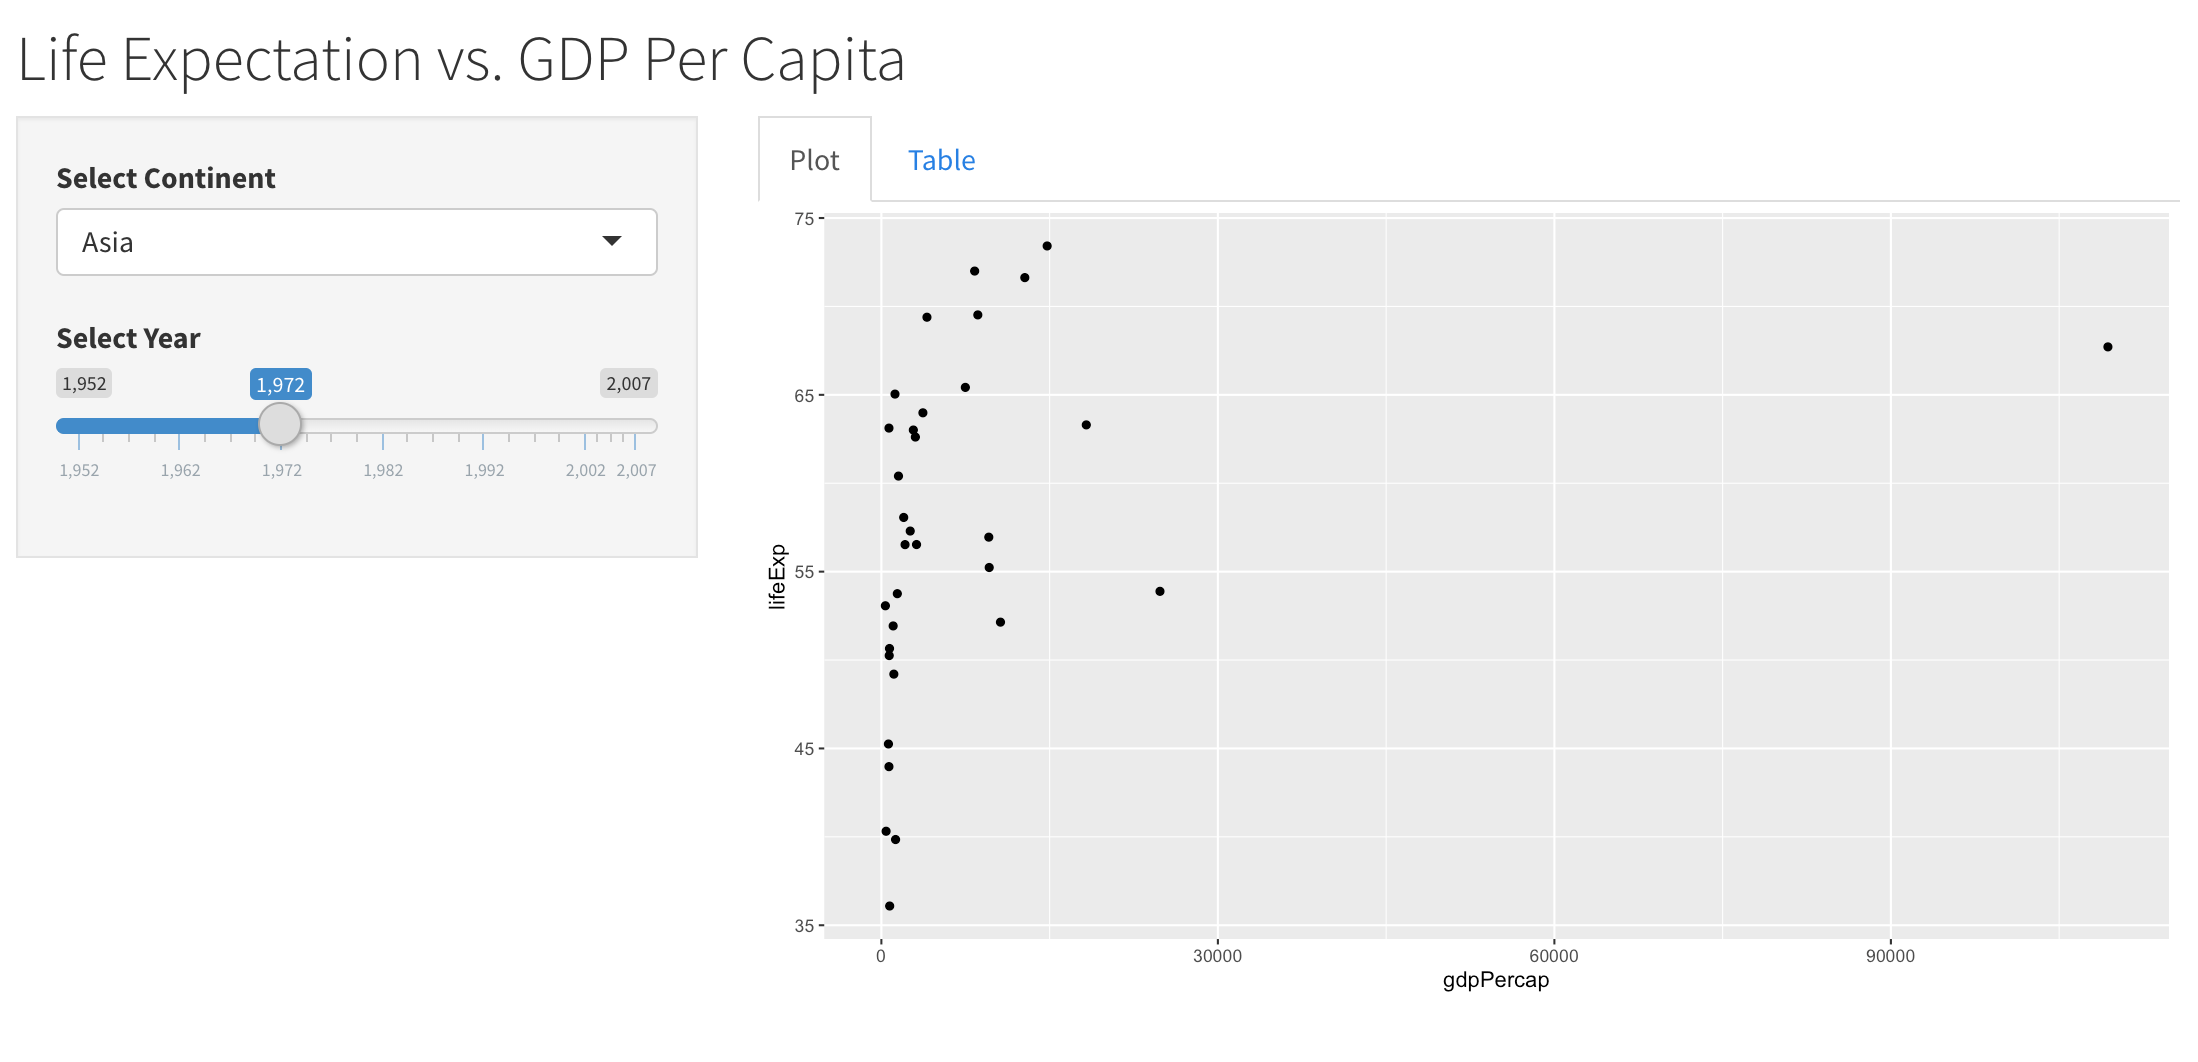
Explore Life Expectation vs. GDP per Capita
Building Web Applications with Shiny in R
Kaelen Medeiros
Data Scientist

