ui <- bootstrapPage(
theme = shinythemes::shinytheme('simplex'),
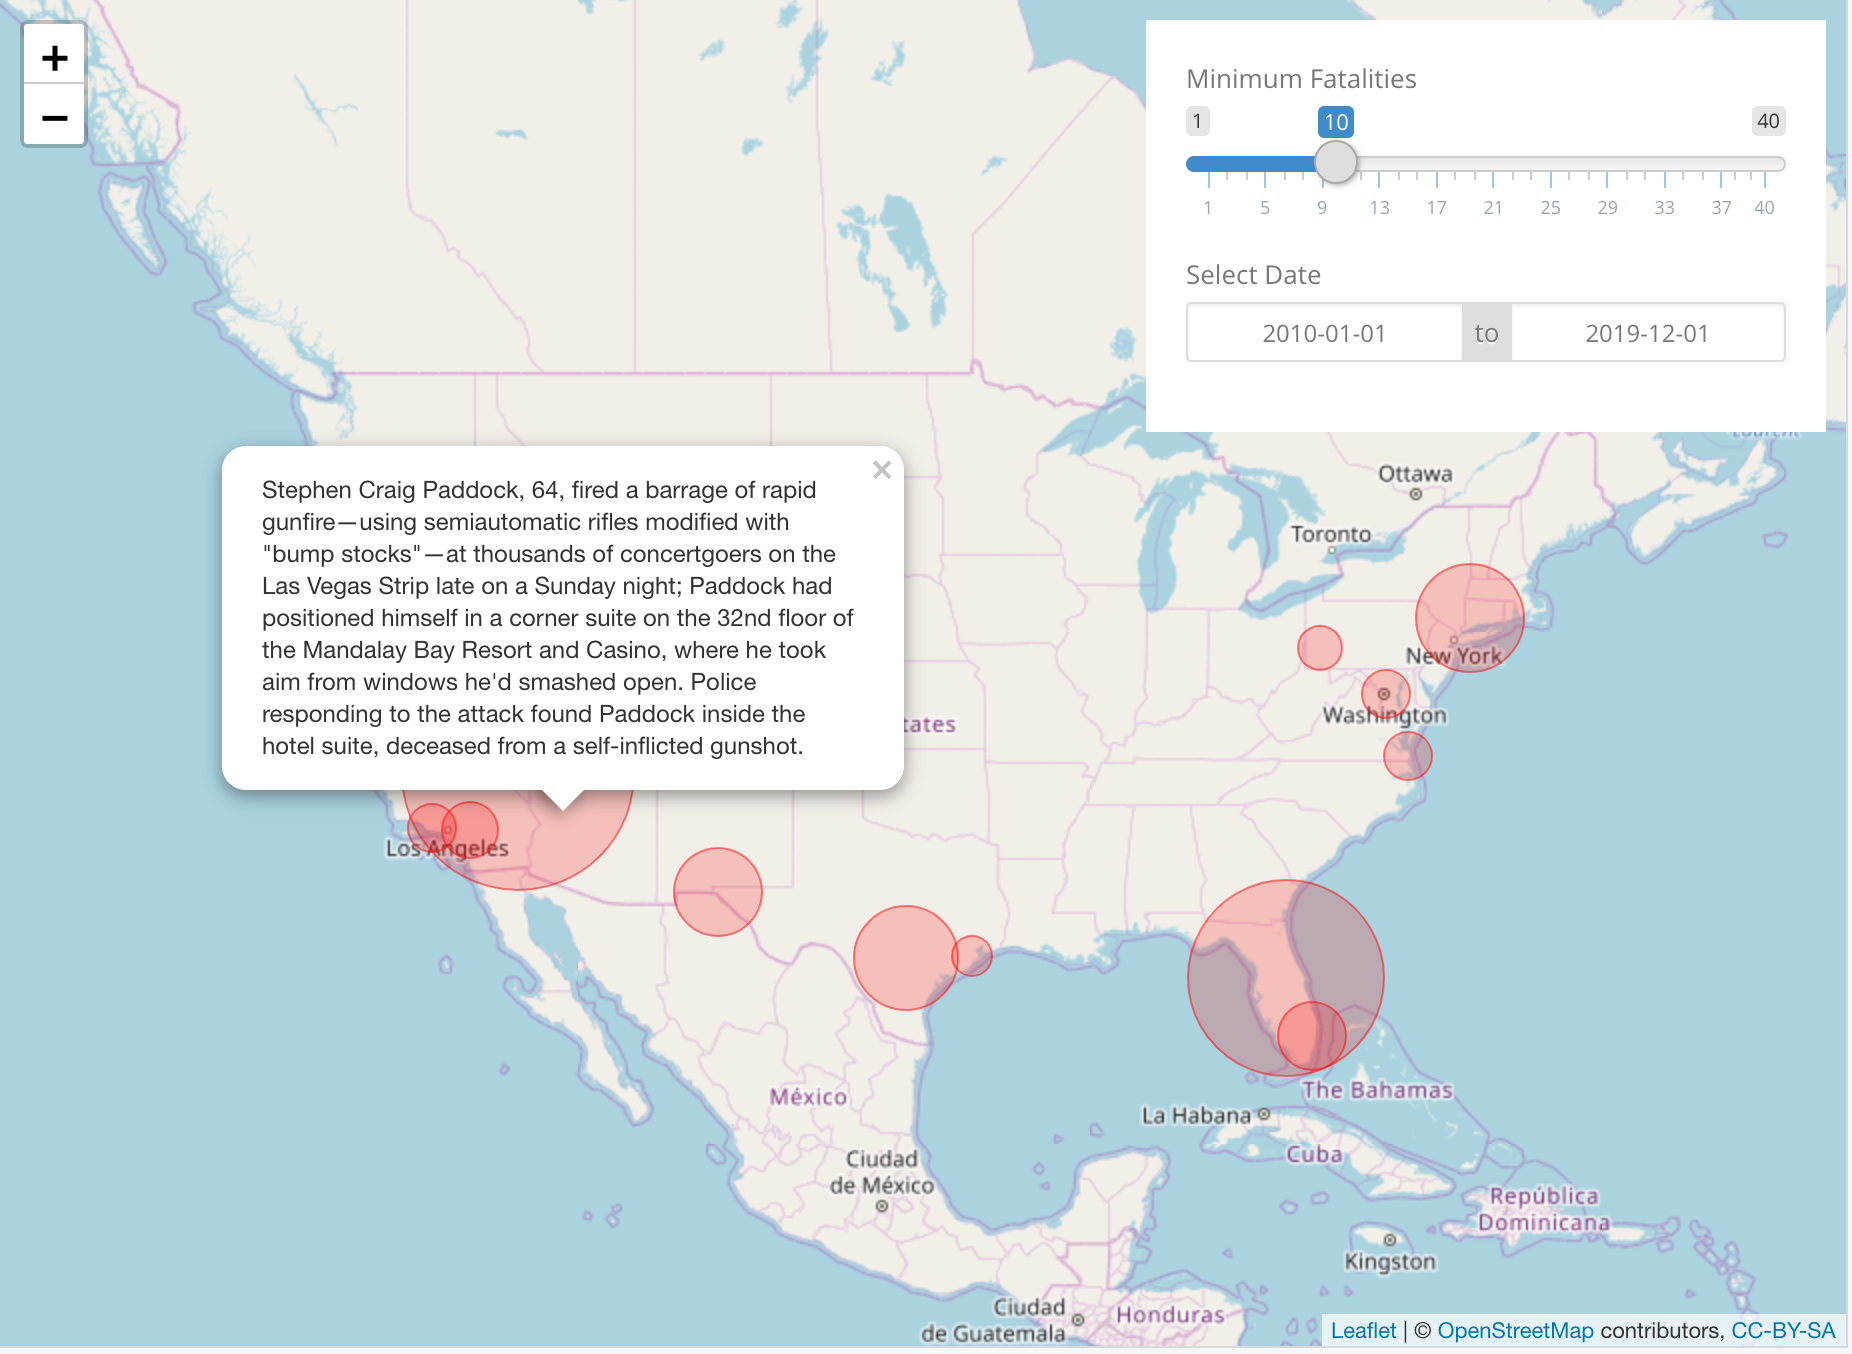
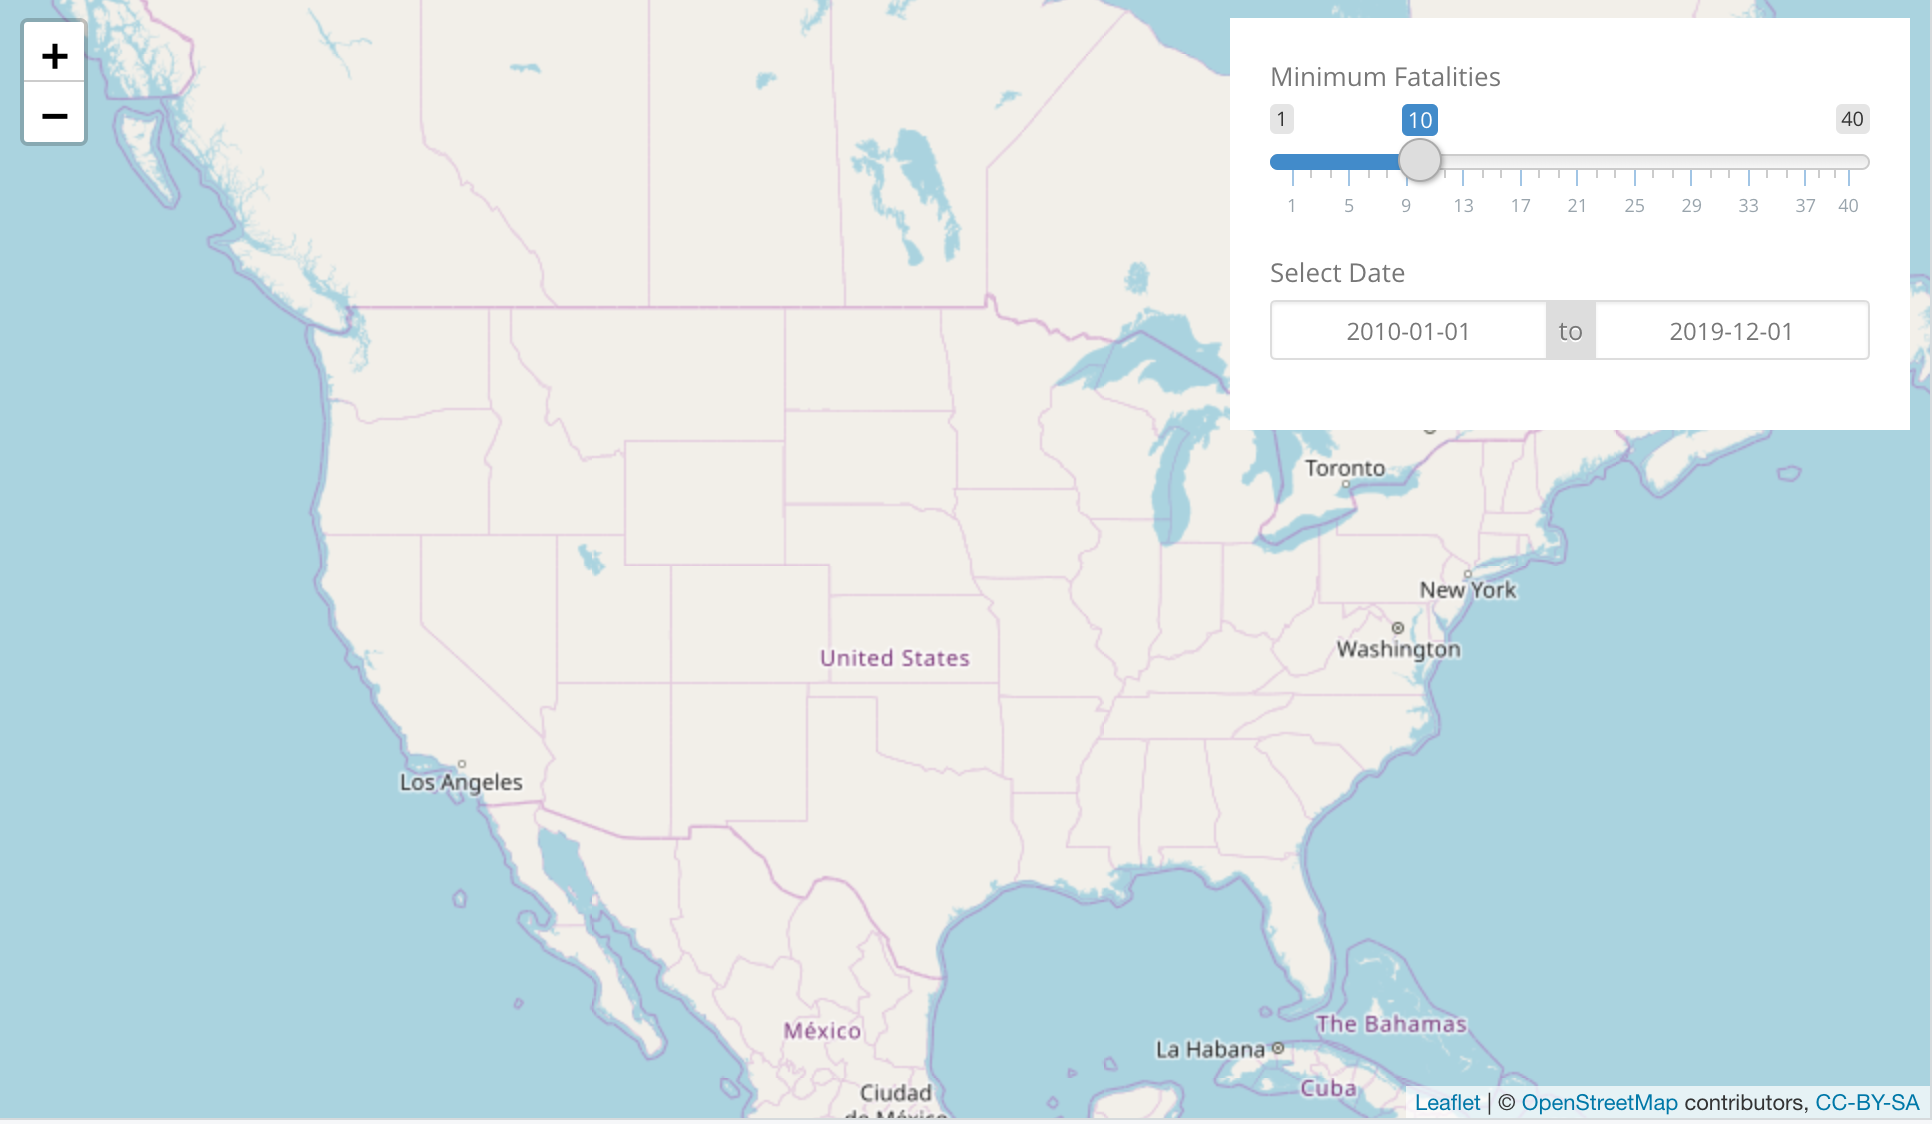
leaflet::leafletOutput('map', width = '100%', height = '100%'),
absolutePanel(top = 10, right = 10, id = 'controls',
sliderInput('nb_fatalities', 'Minimum Fatalities', 1, 40, 10),
dateRangeInput('date_range', 'Select Date', "2010-01-01", "2019-12-01"),
actionButton('show_about', 'About')
)
)
server <- function(input, output, session){

  observeEvent(input$show_about, {

    showModal(modalDialog(text_about, title = 'About'))

  })

}