Plotting twitter data over time
Analyzing Social Media Data in R

Vivek Vijayaraghavan
Data Science Coach
Lesson overview


Time series data
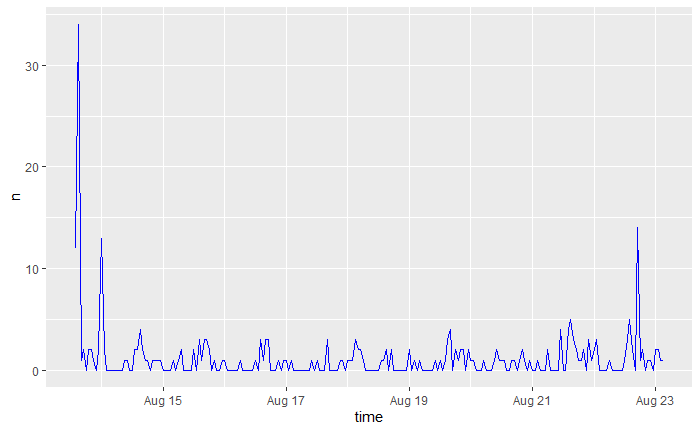
Visualize frequency of tweets

Create time series plot
# Create a time series plot
ts_plot(camry_st, by = "hours", color = "blue")
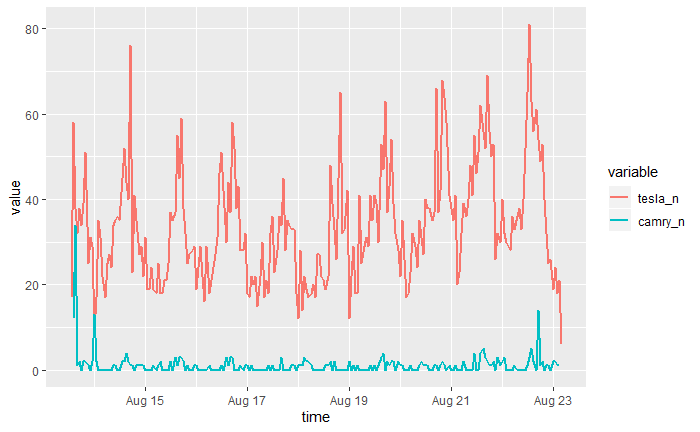
Compare frequency of tweets
- Volume of tweets posted is a strong indicator of brand salience
- Compare the brand salience of Tesla and Camry

The comparison plot