Twitter trends
Analyzing Social Media Data in R

Vivek Vijayaraghavan
Data Science Coach
Lesson Overview
- Understand twitter trends
- Extract trending topics
- Use trends for participation and engagement
What is a twitter trend?
- Keywords, events, or topics that are currently popular
- Discover hottest emerging topics of discussion
- Some trends include a hashtag
- Hashtags help search for trending conversations
- Location trends identify topics in a specific location
Leveraging the power of twitter trends
- Blend marketing messages with trending topic
- Trends help increase tweet engagements
- Travel portal tweets around "#TravelTuesday"
Extract worldwide trends
# Get overall current trending topics
trend_topics <- get_trends()
head(trend_topics$trend, 10)
 [1] "#madebygoogle"         "#????H??????"
 [3] "????"                "Jennifer Aniston"
 [5] "#??????????"     "#FelizMartes"
 [7] "#G????????"       "????"
 [9] "????"                "??????"
- More meaningful to extract trends around a specific region
Locations with current trends
# Extract locations of available twitter trends
trends_avail <- trends_available()
head(trends_avail)
name                        url                          parentid    country
<chr>                      <chr>                           <int>      <chr>
Worldwide     http://where.yahooapis.com/v1/place/1
Winnipeg      http://where.yahooapis.com/v1/place/2972    23424775    Canada
Ottawa        http://where.yahooapis.com/v1/place/3369    23424775    Canada
Quebec        http://where.yahooapis.com/v1/place/3444    23424775    Canada
Montreal      http://where.yahooapis.com/v1/place/3534    23424775    Canada
Toronto       http://where.yahooapis.com/v1/place/4118    23424775    Canada
Trending topics by country
# Get trending topics in the US
gt_US <- get_trends("United States")
Trending topics by country
View(gt_US)
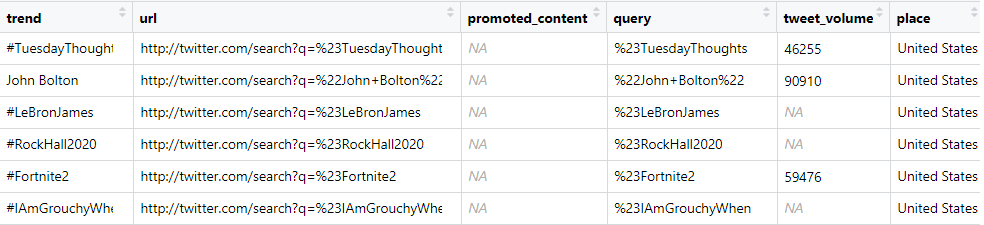
- Music video company can position promotions with "hashtagRockHall2020"
Trending topics by city
- Find trends in a specific city
- Attach tweets around relevant trend
# Get trending topics in New York
gt_city <- get_trends("New York")
Trending topics by city
head(gt_city)
trend                            url                        promoted_content
<chr>                           <chr>                             <lgl>
Lions            http://twitter.com/search?q=Lions                  NA
Green Bay        http://twitter.com/search?q=%22Green+Bay%22        NA
#DETvsGB         http://twitter.com/search?q=%23DETvsGB             NA
LeBron           http://twitter.com/search?q=LeBron                 NA
Aaron Rodgers    http://twitter.com/search?q=%22Aaron+Rodgers%22    NA
#90DayFiance     http://twitter.com/search?q=%2390DayFiance         NA
- Company promoting basketball merchandise could leverage this trend
Most tweeted trends
tweet_volumehas count of tweets made on a trending topic- It is available for some trends only
- Identify trends that are most tweeted
Most tweeted trends
# Aggregate trends and tweet volumes
library(dplyr)
trend_df <- gt_city %>%
              group_by(trend) %>%
              summarize(tweet_vol = mean(tweet_volume))
Most tweeted trends
head(trend_df)
trend                  tweet_vol
<chr>                    <dbl>
#90DayFiance             14375
#acefamilyisoverparty    12760
#ascendwithme            NA
#bbcon2019               NA
#bookbirthday            NA
#DemDebate               18928
Most tweeted trends
# Sort data frame on descending order of tweet volumes
trend_df_sort <- arrange(trend_df, desc(tweet_vol))
Most tweeted trends
# View the most tweeted trends
head(trend_df_sort)
trend              tweet_vol
<chr>               <dbl>
LeBron              298302
Lions               267945
Columbus Day        135014
John Bolton         118933
#DETvsGB            67197
#TuesdayThoughts    63259
- Travel company can promote holiday packages around "Columbus Day"
Let's practice!
Analyzing Social Media Data in R

