Putting twitter data on the map
Analyzing Social Media Data in R

Sowmya Vivek
Data Science Coach
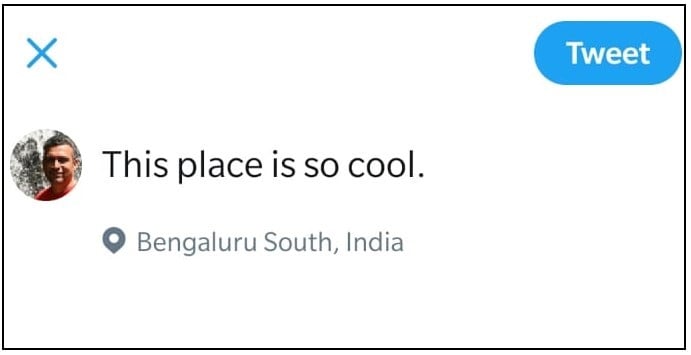
Place
- "Place" location is selected from a predefined list
- Includes a bounding box with latitude and longitude coordinates
- Not necessarily issued from the location of the tweet
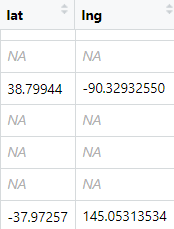
View lat and lng columns
View(pol_coord)
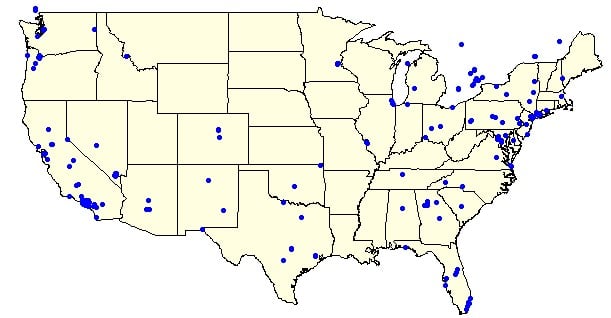
View the locations on the US state map
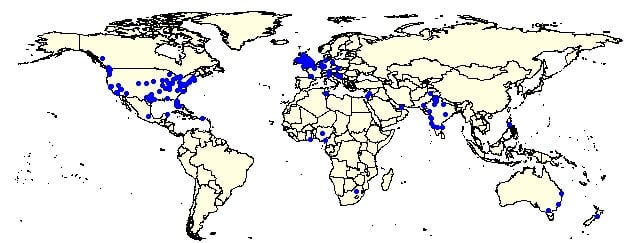
View the locations on the world map