Extreme value theory
Quantitative Risk Management in Python

Jamsheed Shorish
Computational Economist
Extreme values
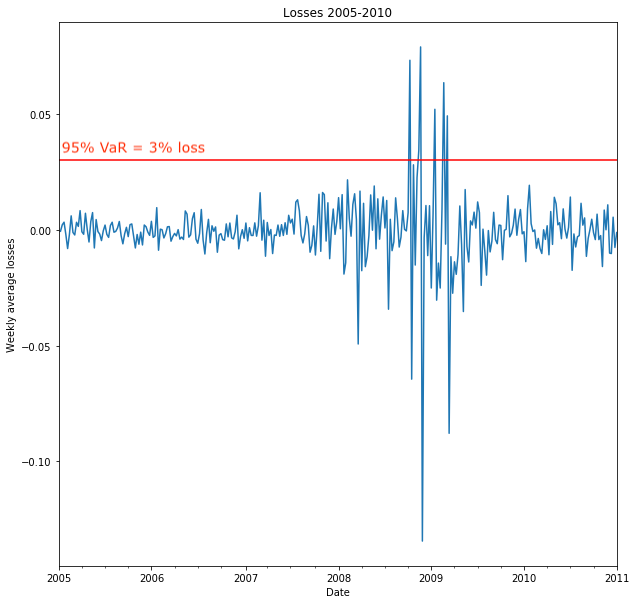
- Portfolio losses: extreme values

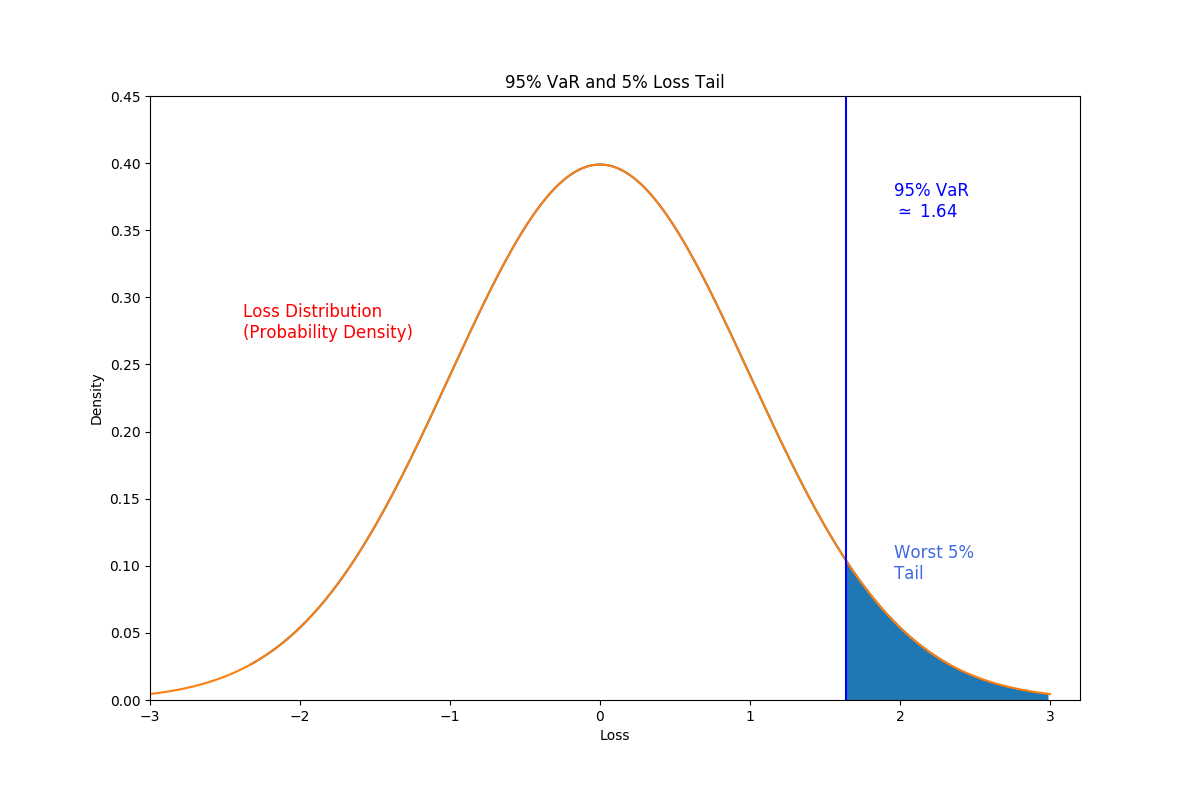
- Extreme values: from tail of distribution
- Tail losses: losses exceeding some value
- Model tail losses => better risk management

Extreme value theory
- Extreme value theory: statistical distribution of extreme values
- Block maxima

Extreme value theory
- Extreme value theory: statistical distribution of extreme values
- Block maxima:
- Break period into sub-periods

Extreme value theory
- Extreme value theory: statistical distribution of extreme values
- Block maxima:
- Break period into sub-periods
- Form block from each sub-period

Extreme value theory
- Extreme value theory: statistical distribution of extreme values
- Block maxima:
- Break period into sub-periods
- Form blocks from each sub-period
- Set of block maxima = dataset
- Peak over threshold (POT):
- Find all losses over given level
- Set of such losses = dataset

Generalized Extreme Value Distribution
Example: Block maxima for 2007 - 2009
- Resample losses with desired period (e.g. weekly)
maxima = losses.resample("W").max()
- Resample losses with desired period (e.g. weekly)
Generalized Extreme Value Distribution (GEV)
- Distribution of maxima of data
- Example: parametric estimation using
scipy.stats.genextremefrom scipy.stats import genextreme params = genextreme.fit(maxima)
VaR and CVaR from GEV distribution
- 99% VaR from GEV distribution
- Use
.ppf()percent point function to find 99% VaR - Requires
paramsfrom fitted GEV distribution - Finds maximum loss over one week period at 99% confidence
- Use
- 99% CVaR from GEV distribution
- CVaR is conditional expectation of loss given VaR as minimum loss
- Use
.expect()method to find expected value
VaR_99 = genextreme.ppf(0.99, *params)
CVar_99 = ( 1 / (1 - 0.99) ) * genextreme.expect(lambda x: x, *params, lb = VaR_99)
Covering losses
- Risk management: covering losses
- Regulatory requirement (banks, insurance)
- Reserves must be available to cover losses
- For a specified period (e.g. one week)
- At a specified confidence level (e.g. 99%)
- VaR from GEV distribution:
- estimates maximum loss
- given period
- given confidence level
- estimates maximum loss
Covering losses
- Example: Initial portfolio value = $1,000,000
- One week reserve requirement at 99% confidence
- $\text{VaR}_{99}$ from GEV distribution: maximum loss over one week at 99% confidence
- Reserve requirement: Portfolio value x $\text{VaR}_{99}$
- Suppose $\text{VaR}_{99}$ = 0.10, i.e. 10% maximum loss
- Reserve requirement = $100,000
- Portfolio value changes => reserve requirement changes
- Regulation sets frequency of reserve requirement updating
Let's practice!
Quantitative Risk Management in Python

