Parametric Estimation
Quantitative Risk Management in Python

Jamsheed Shorish
Computational Economist
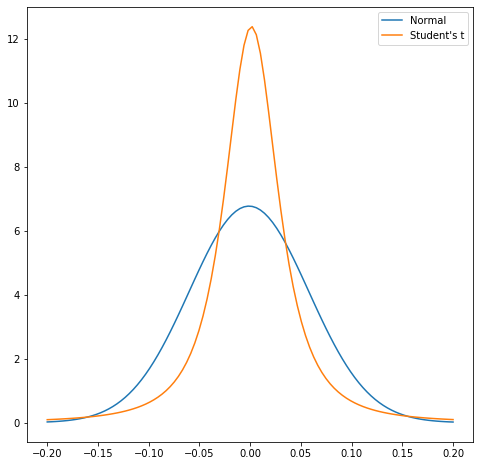
Goodness of fit
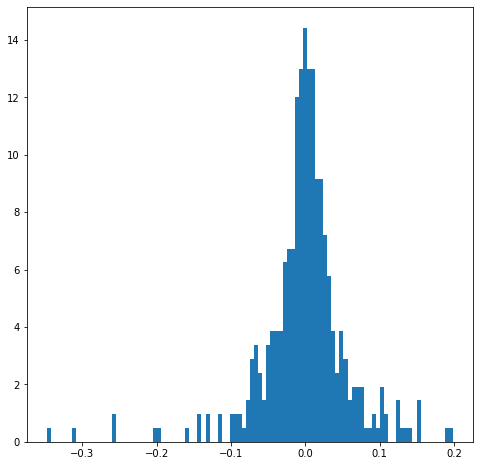
Goodness of fit
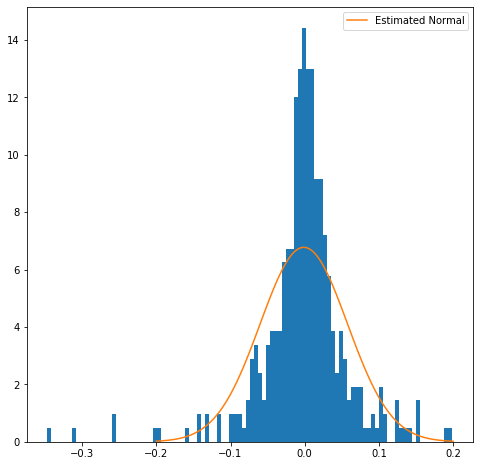
Goodness of fit
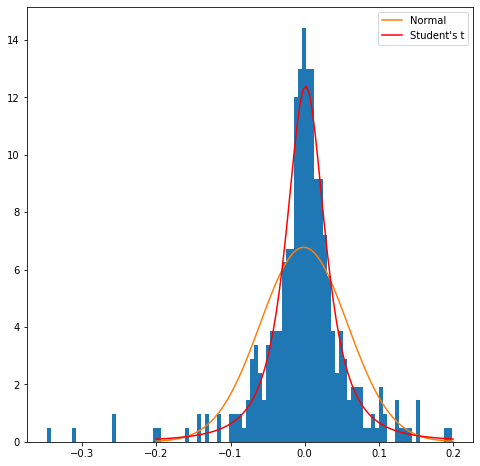
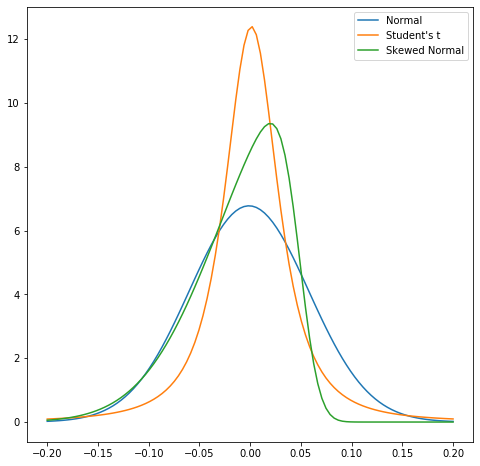
Skewness
Skewness
Skewness
Quantitative Risk Management in Python
Jamsheed Shorish
Computational Economist

