Measuring Risk
Quantitative Risk Management in Python

Jamsheed Shorish
CEO, Shorish Research
The Loss Distribution
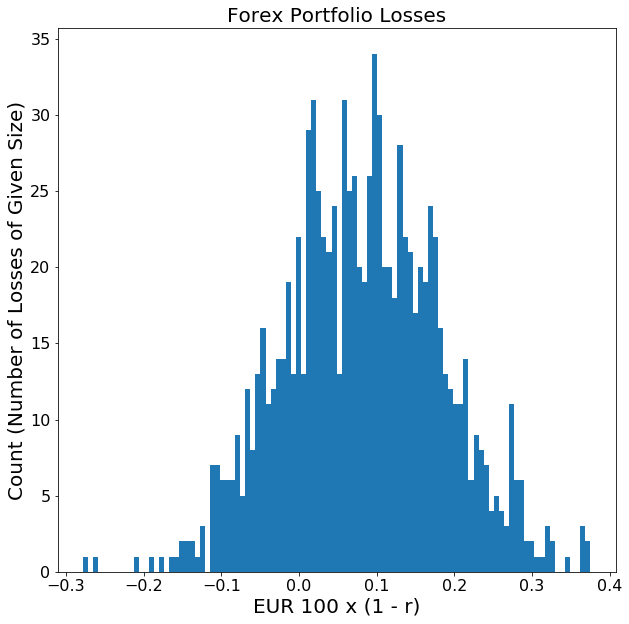
- Forex Example:
- Portfolio value in U.S. dollars is USD 100
- Risk factor =
 /
/  exchange rate
 - Portfolio value in EURO if 1 = 1 : USD 100 x EUR 1 / USD 1 = EUR 100.
- Portfolio value in EURO if r = 1 : = USD 100 x EUR r / 1 USD = EUR 100 x r
- Loss = EUR 100 - EUR 100 x r = EUR 100 x (1 - r)
- Loss distribution: Random realizations of r => distribution of portfolio losses in the future
Value at Risk (VaR)
Conditional Value at Risk (CVaR)
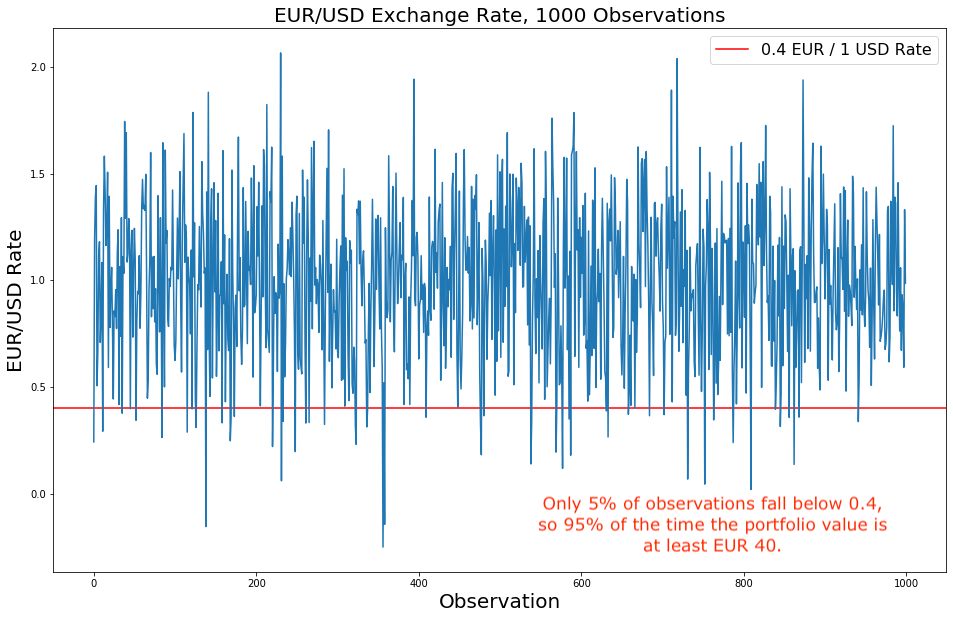
- Forex Example:
- 95% CVaR = expected loss for 5% of cases when portfolio value smaller than EUR 40
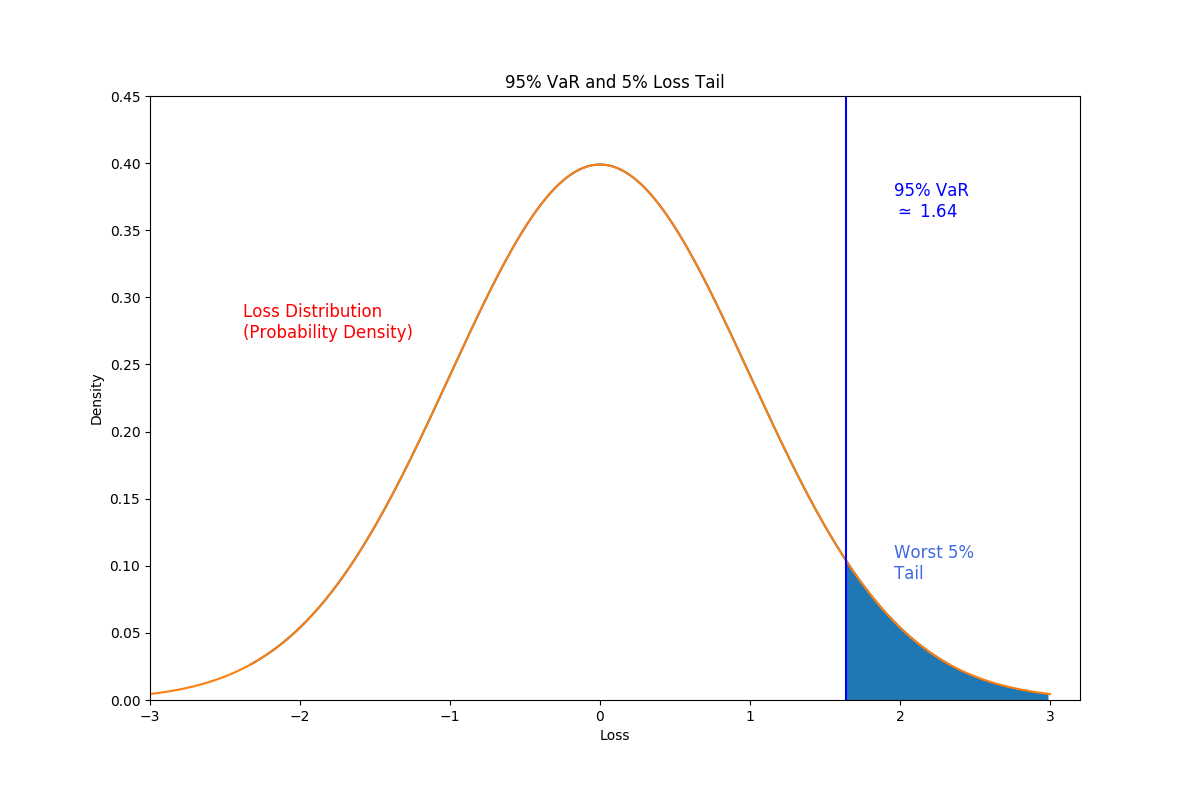
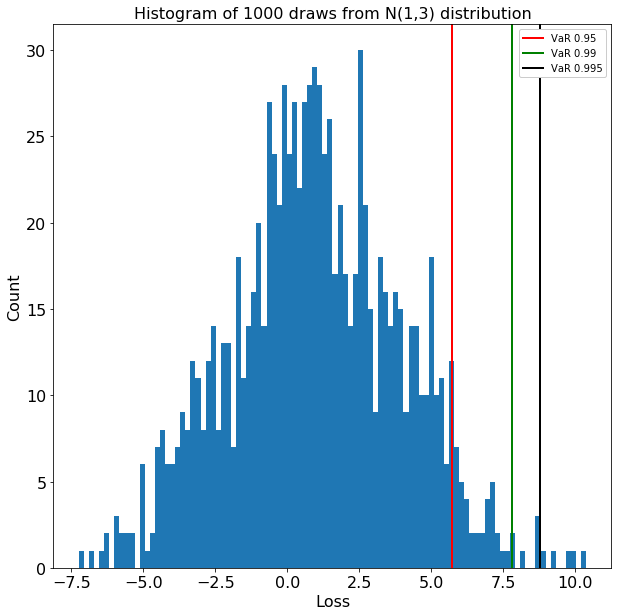
Visualizing the VaR
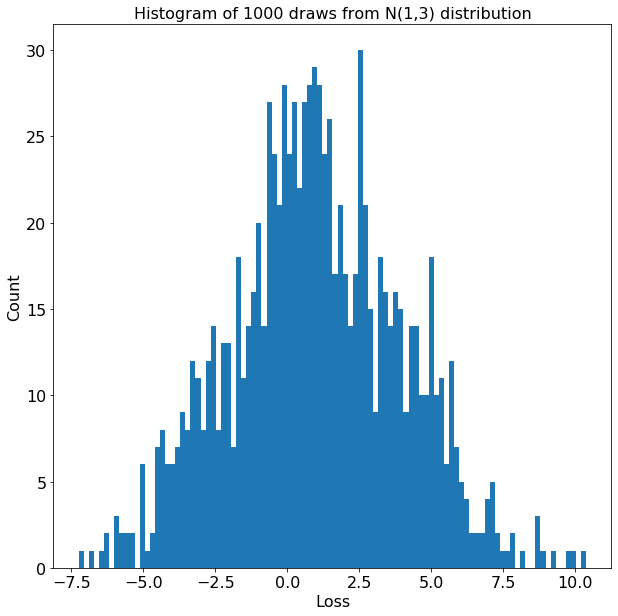
Visualizing the VaR

Visualizing the VaR

Visualizing the VaR