Effective explanatory plots
Introduction to Data Visualization with ggplot2

Rick Scavetta
Founder, Scavetta Academy
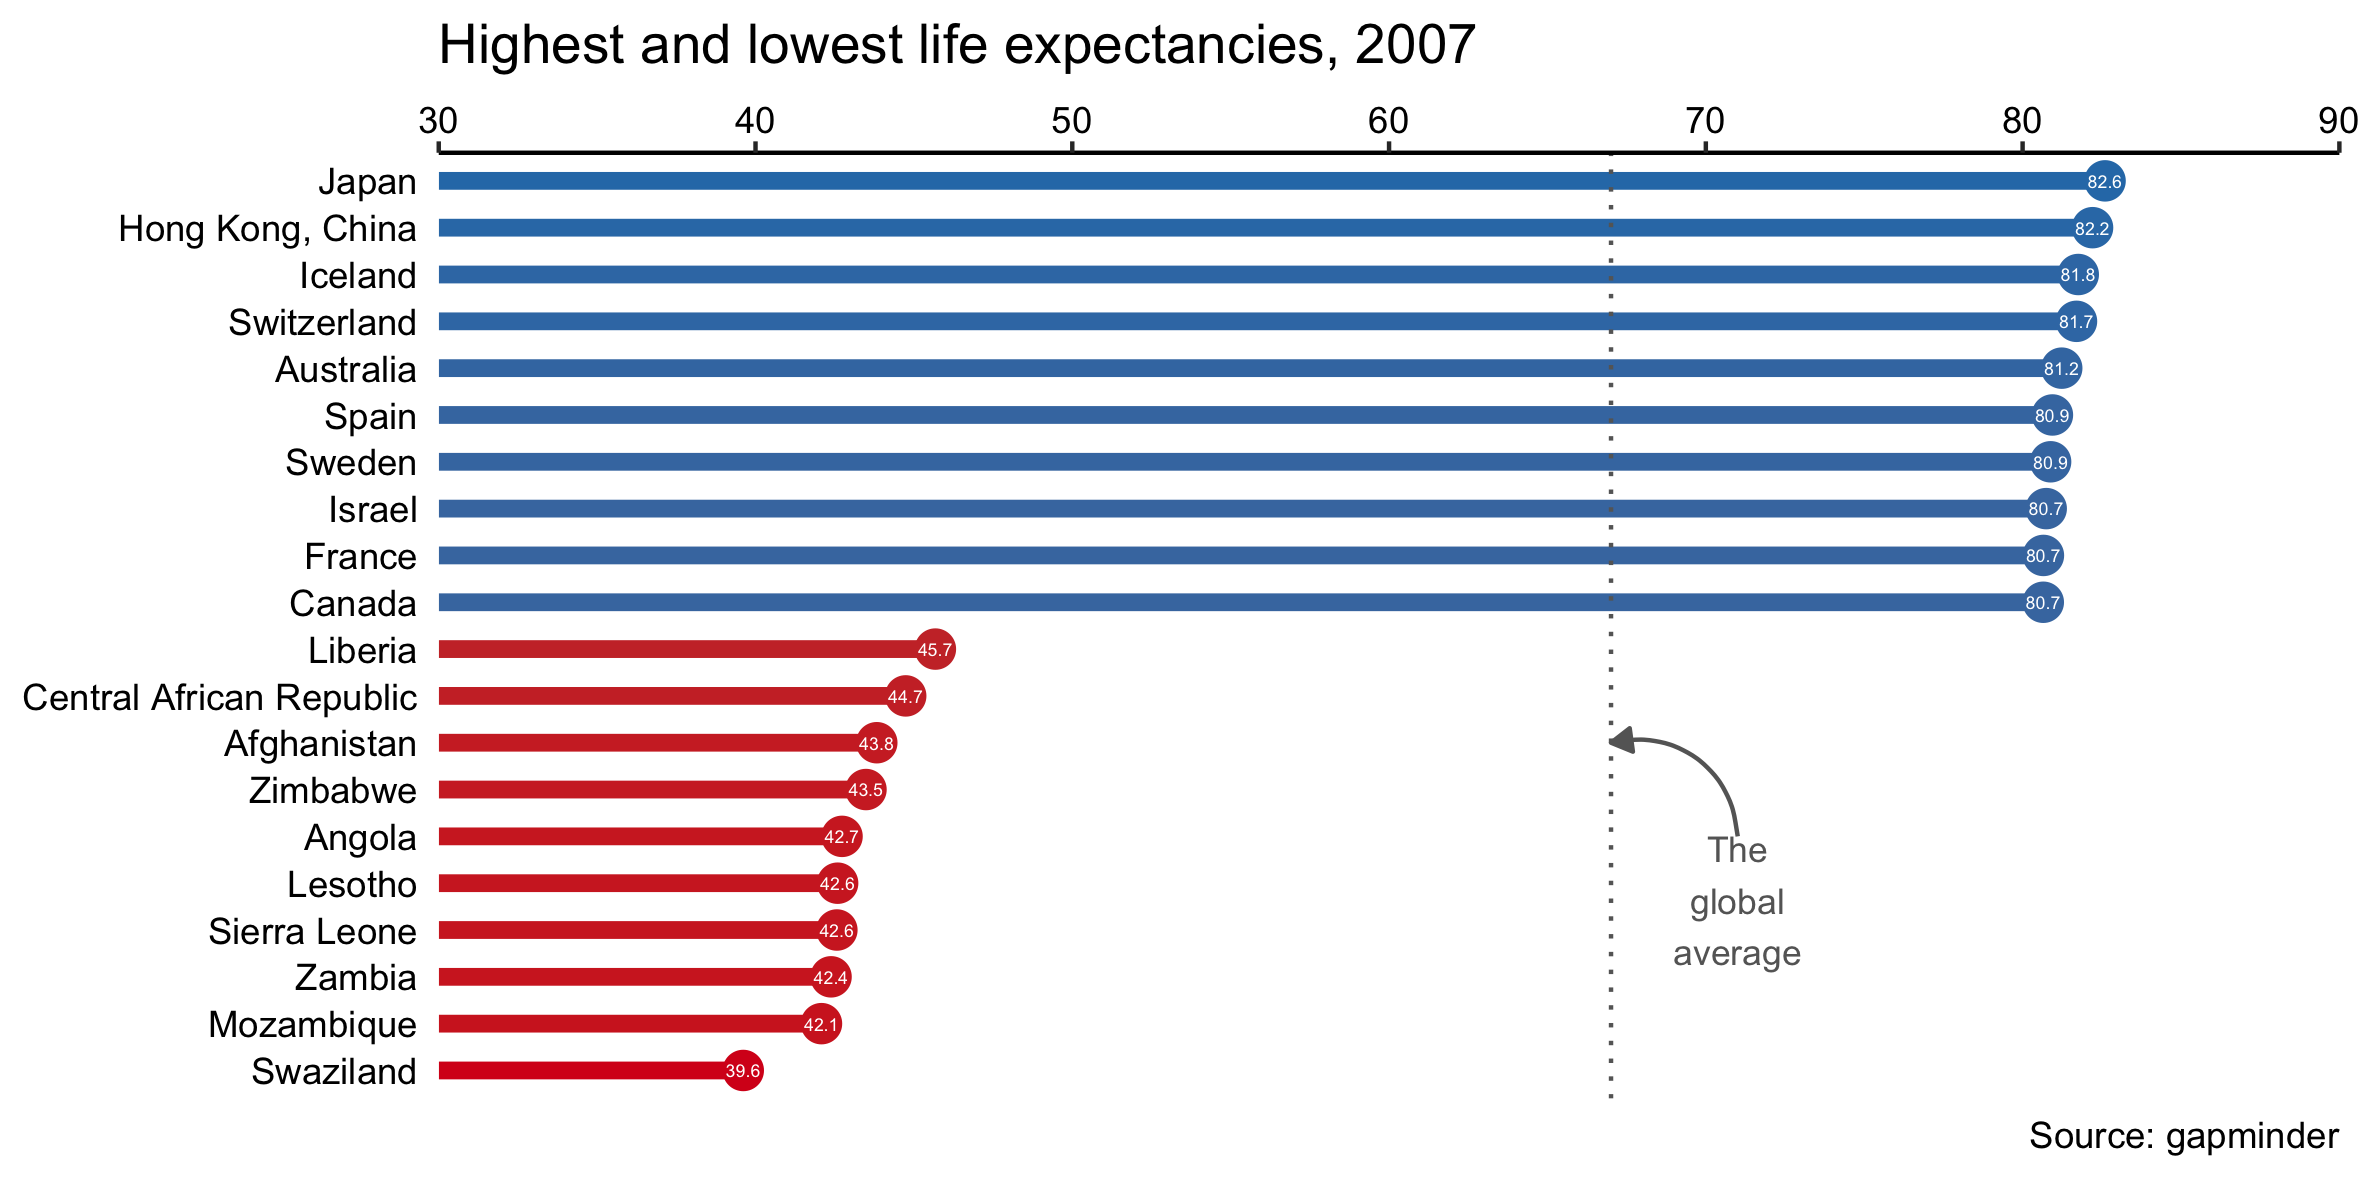
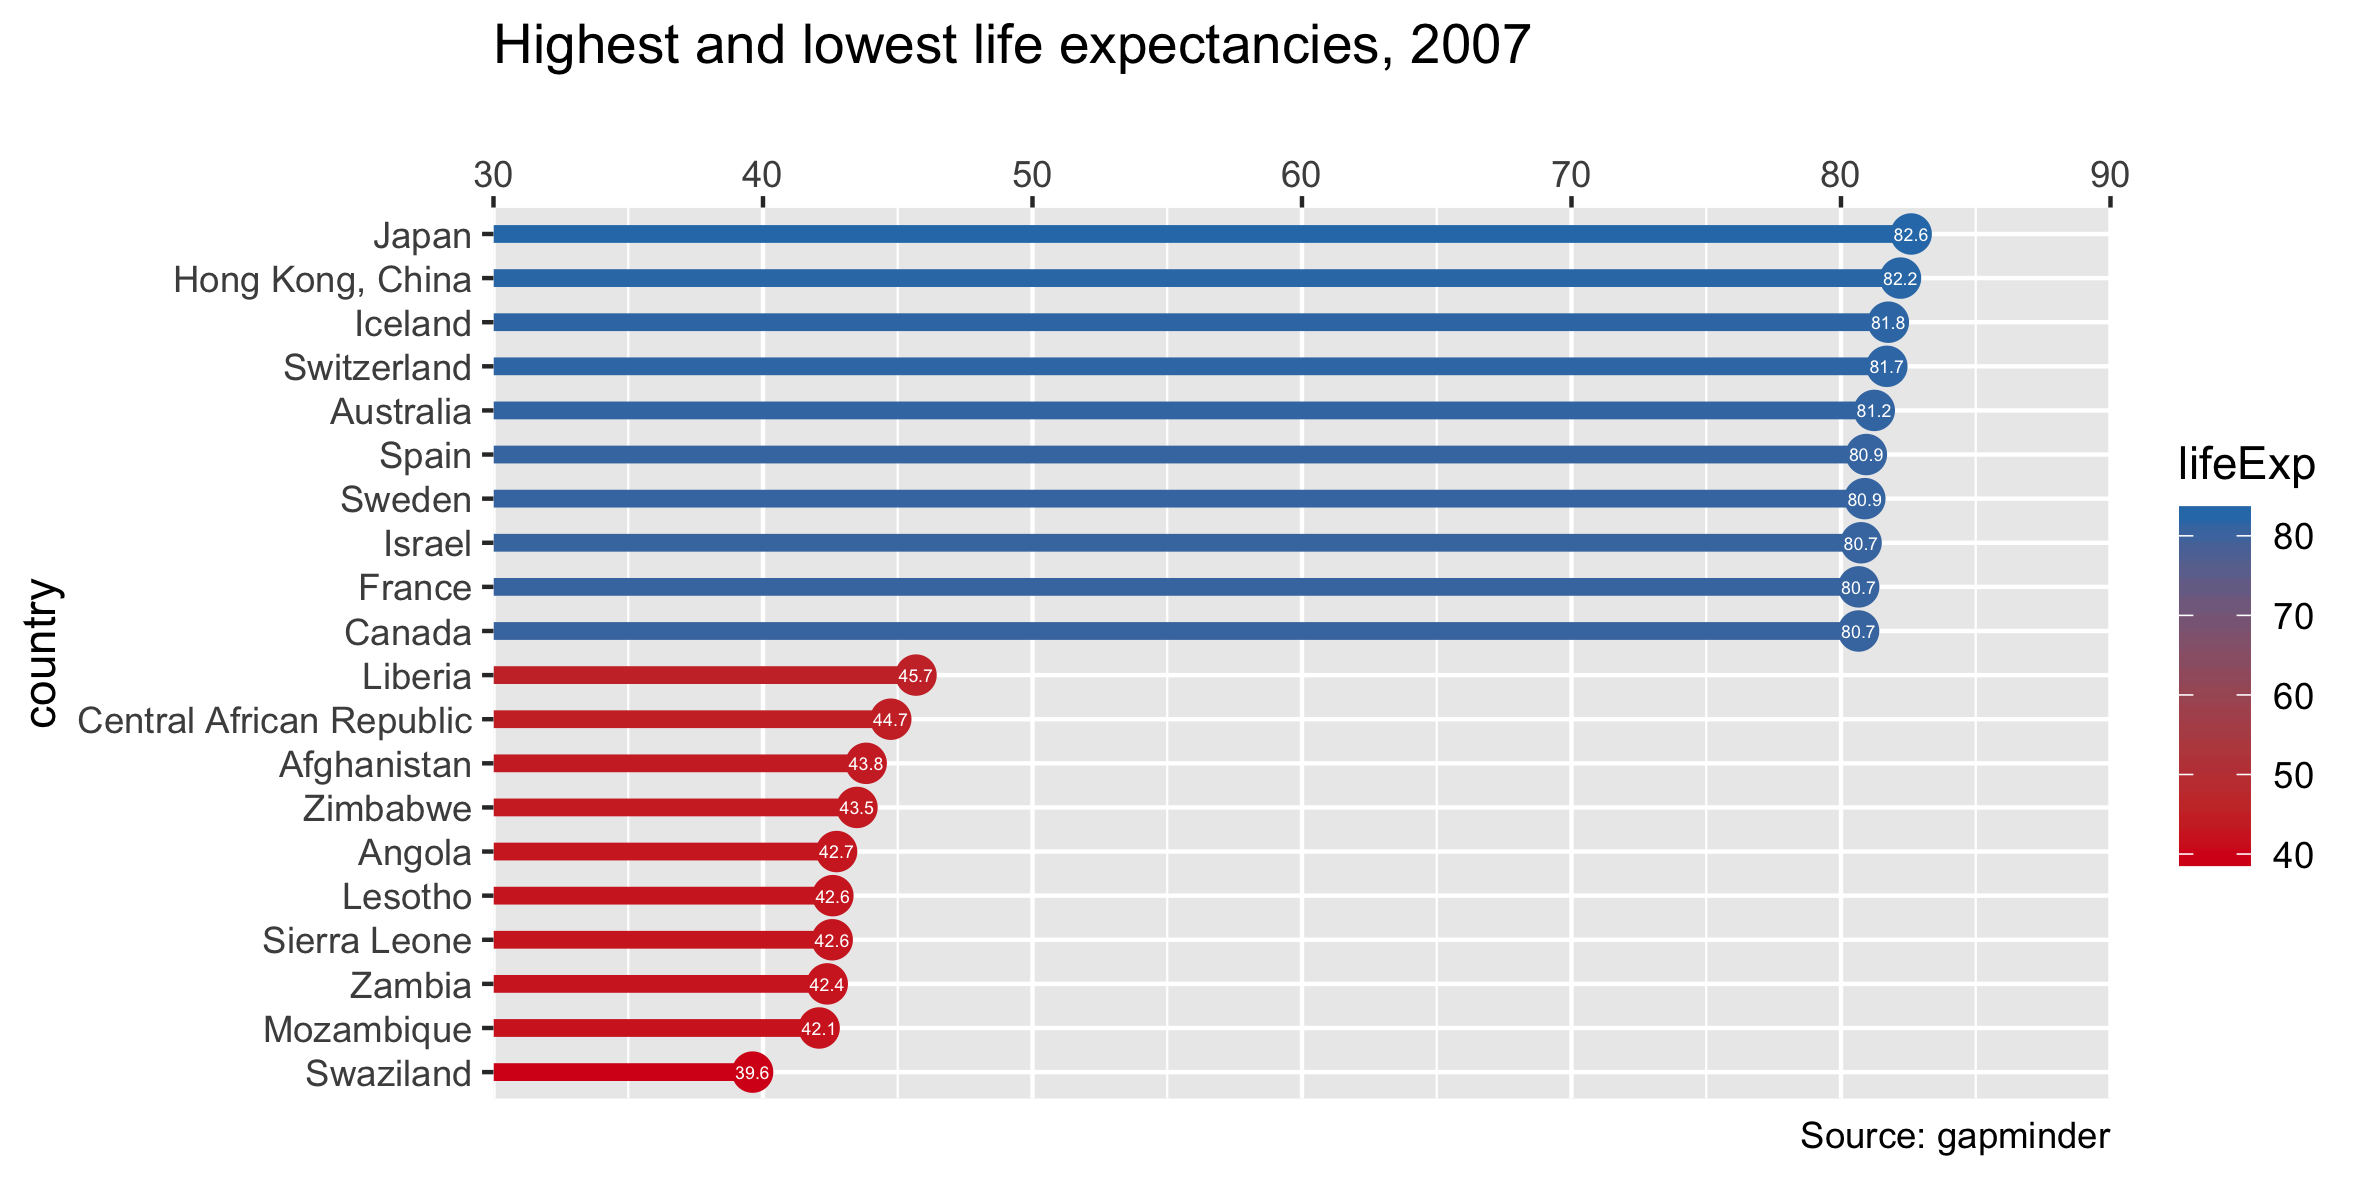
Our goal, an effective explanatory plot
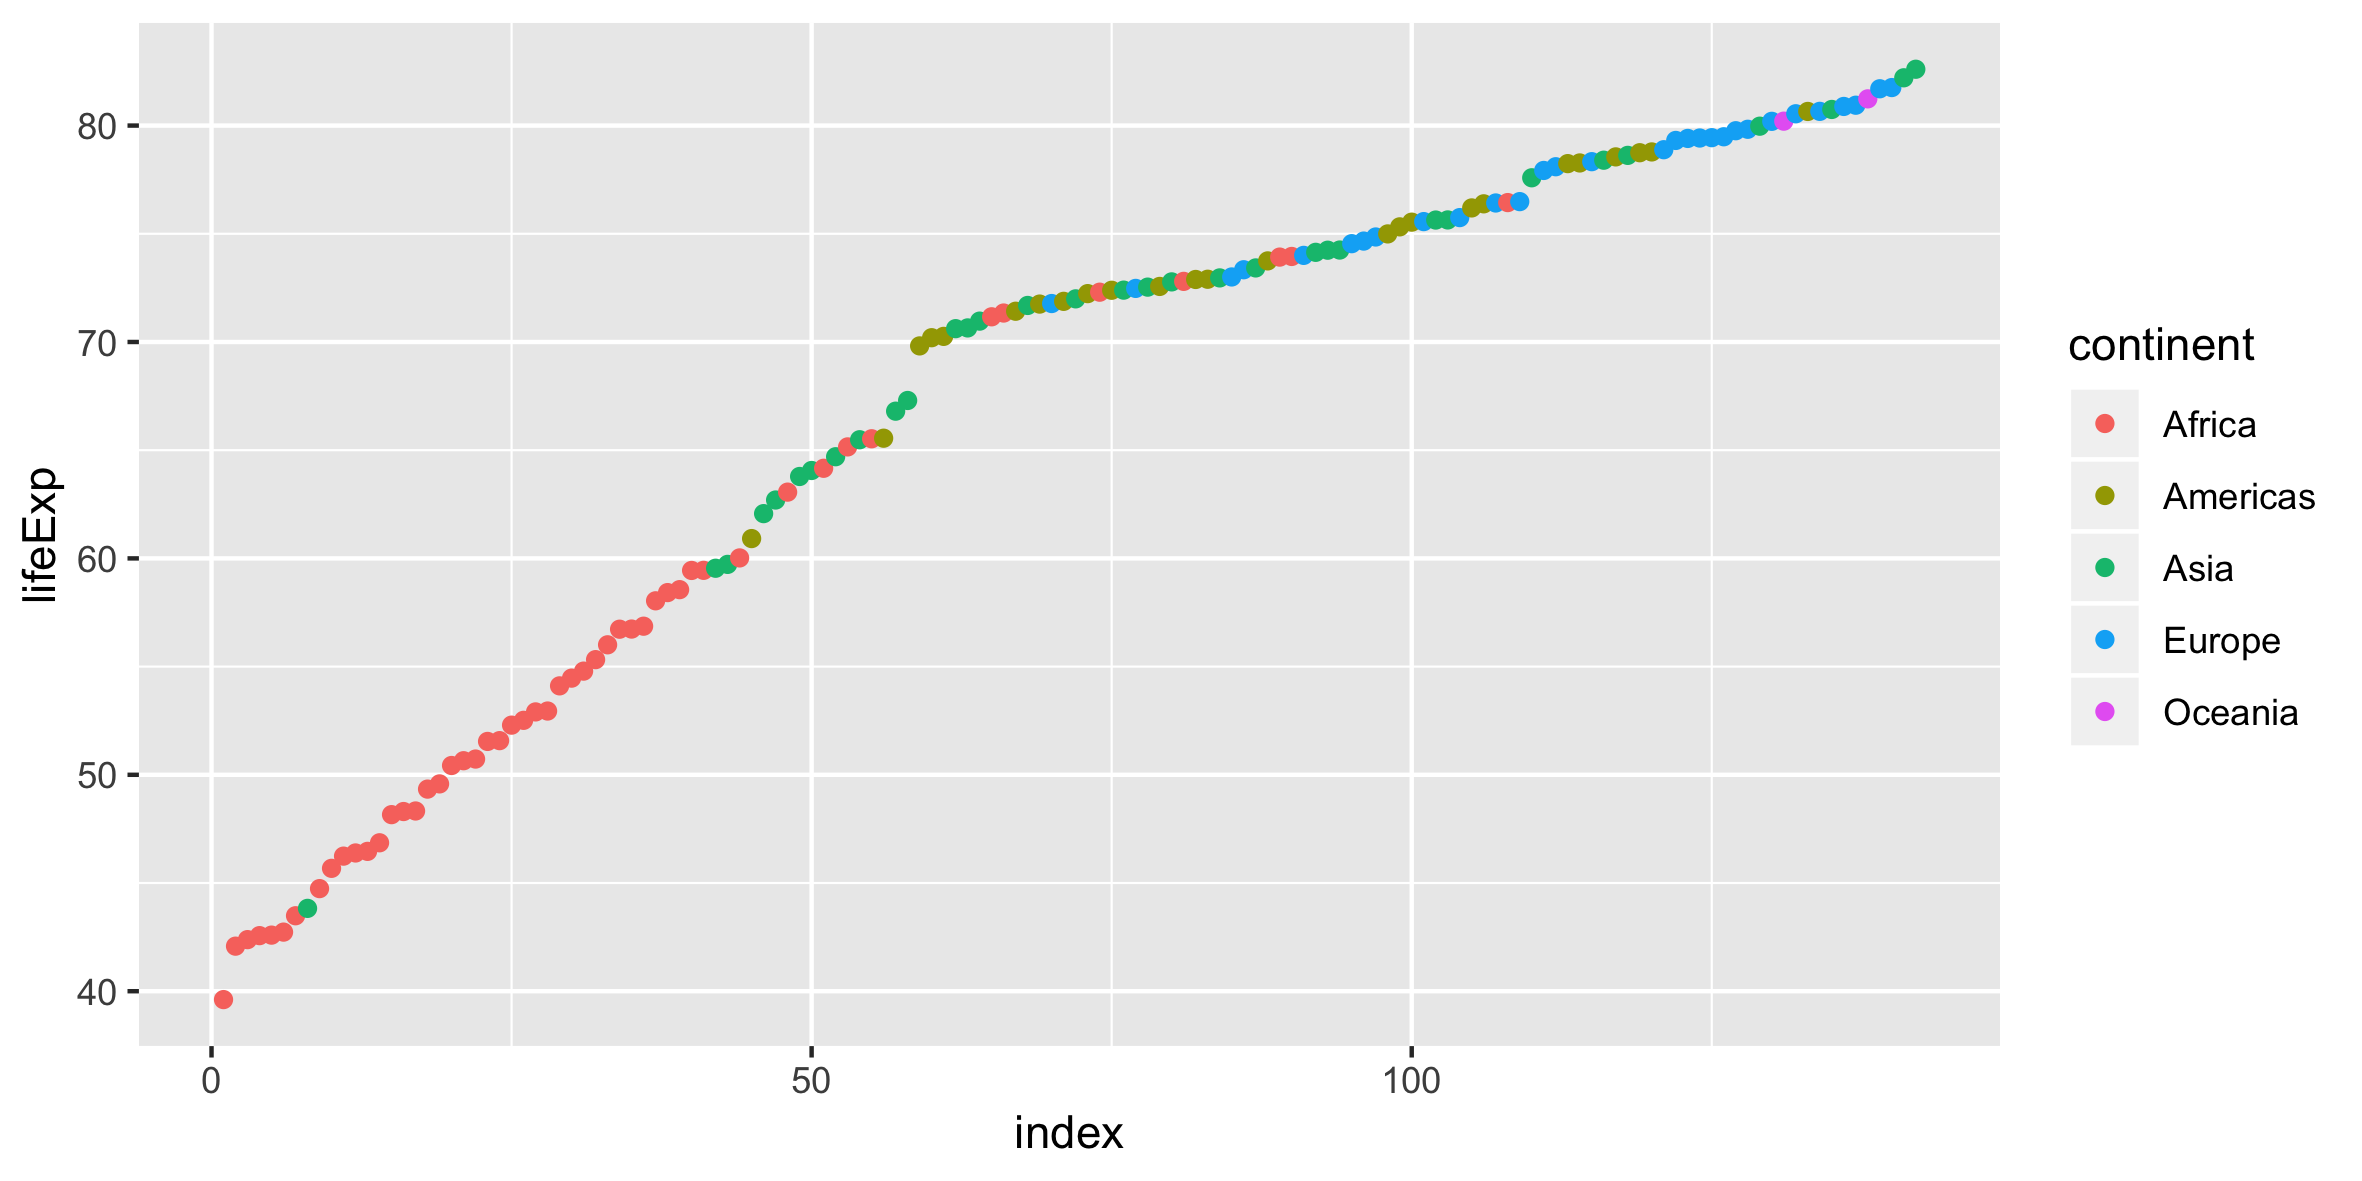
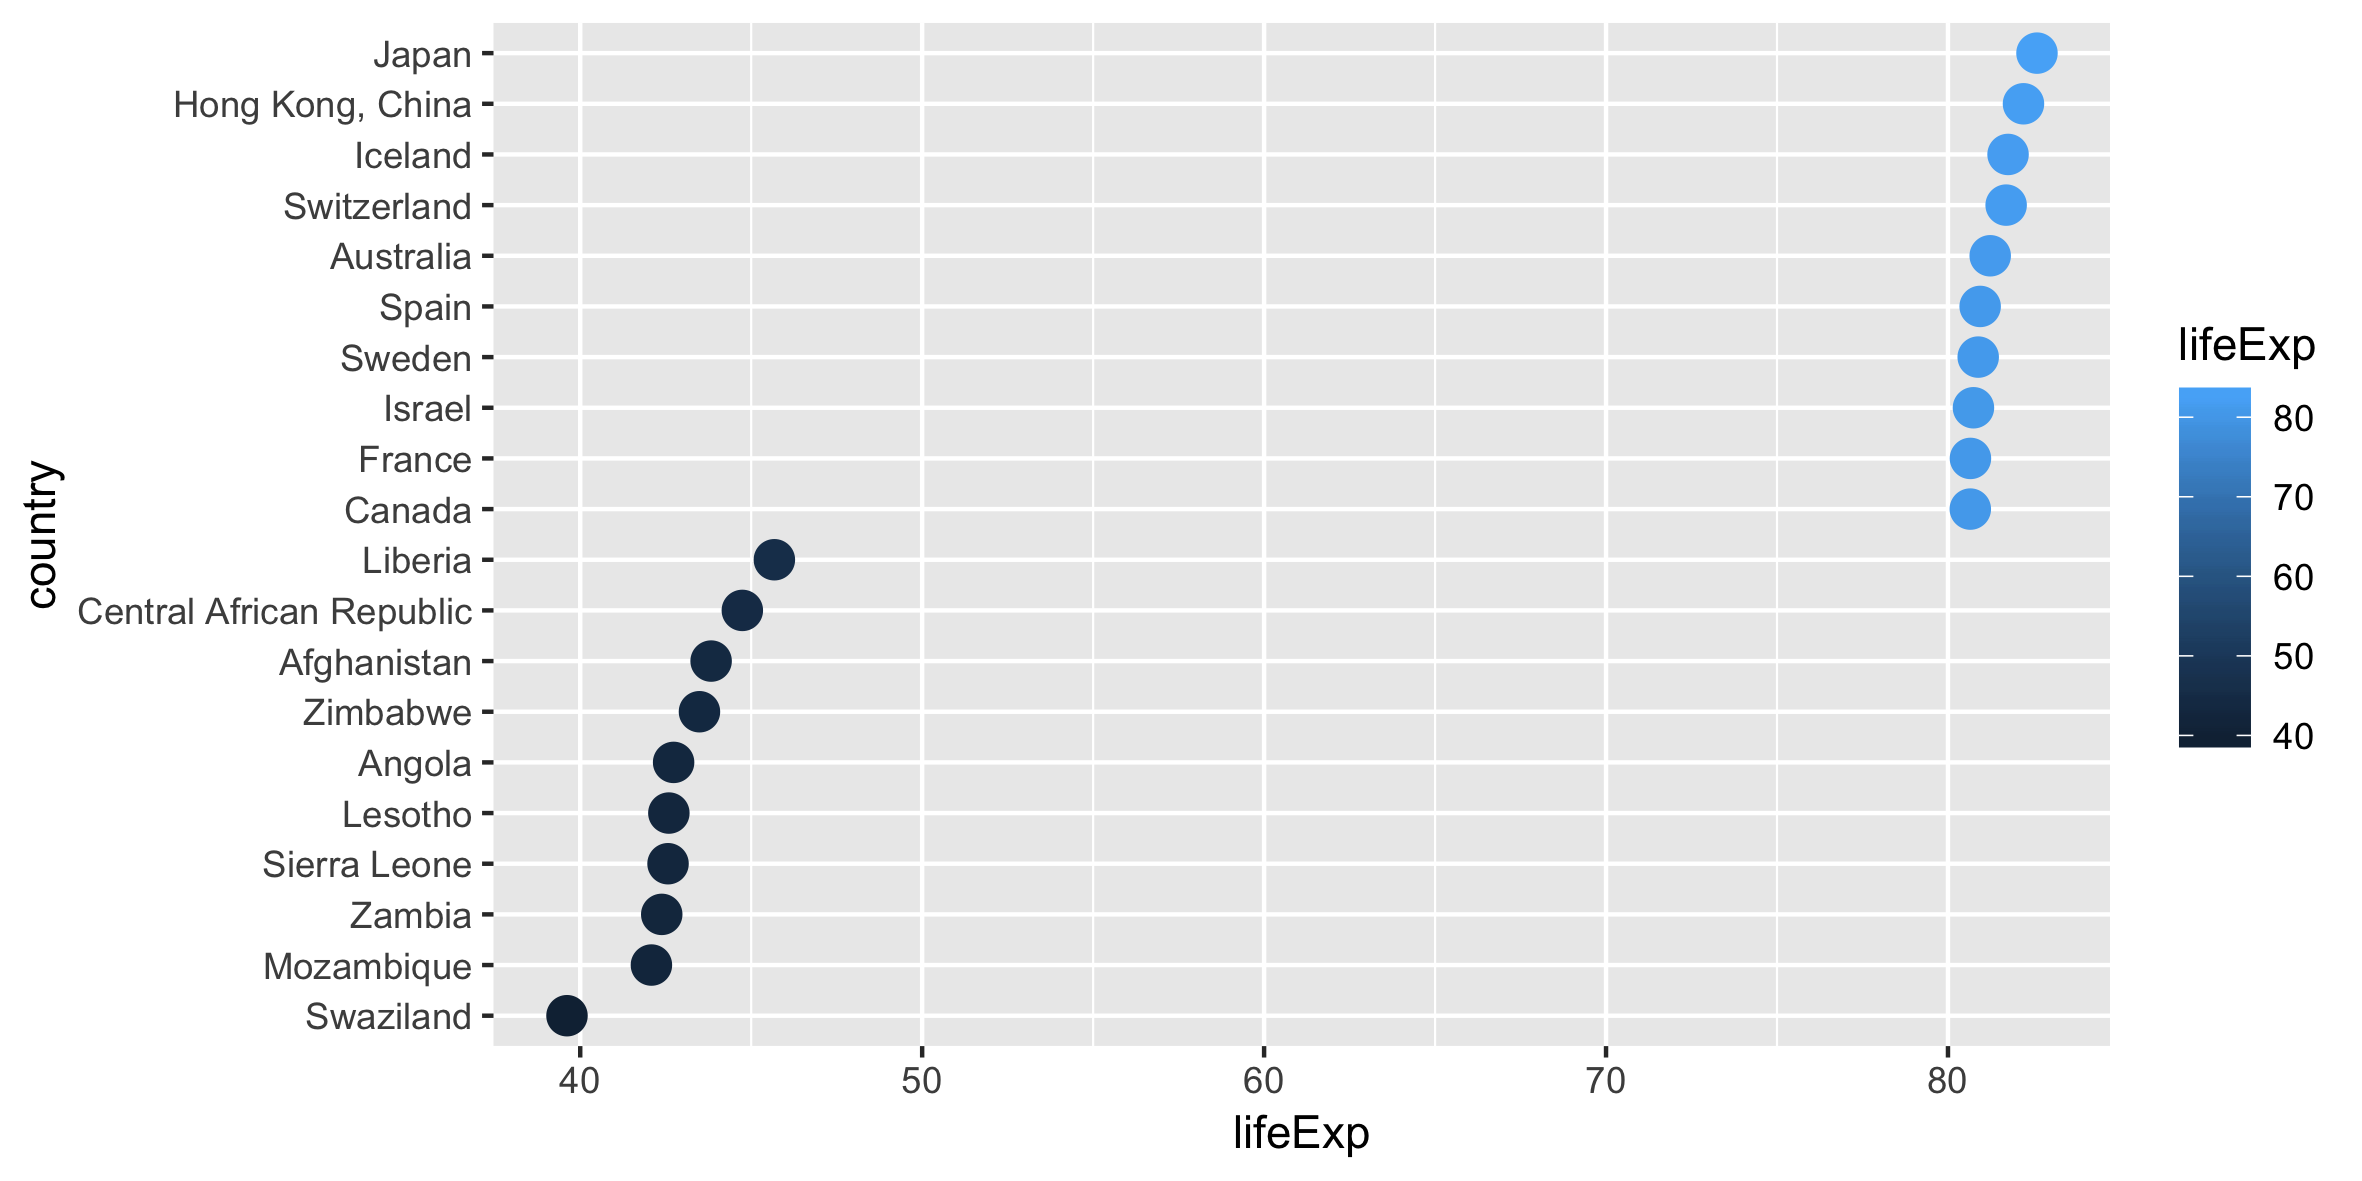
First exploratory plots - distributions
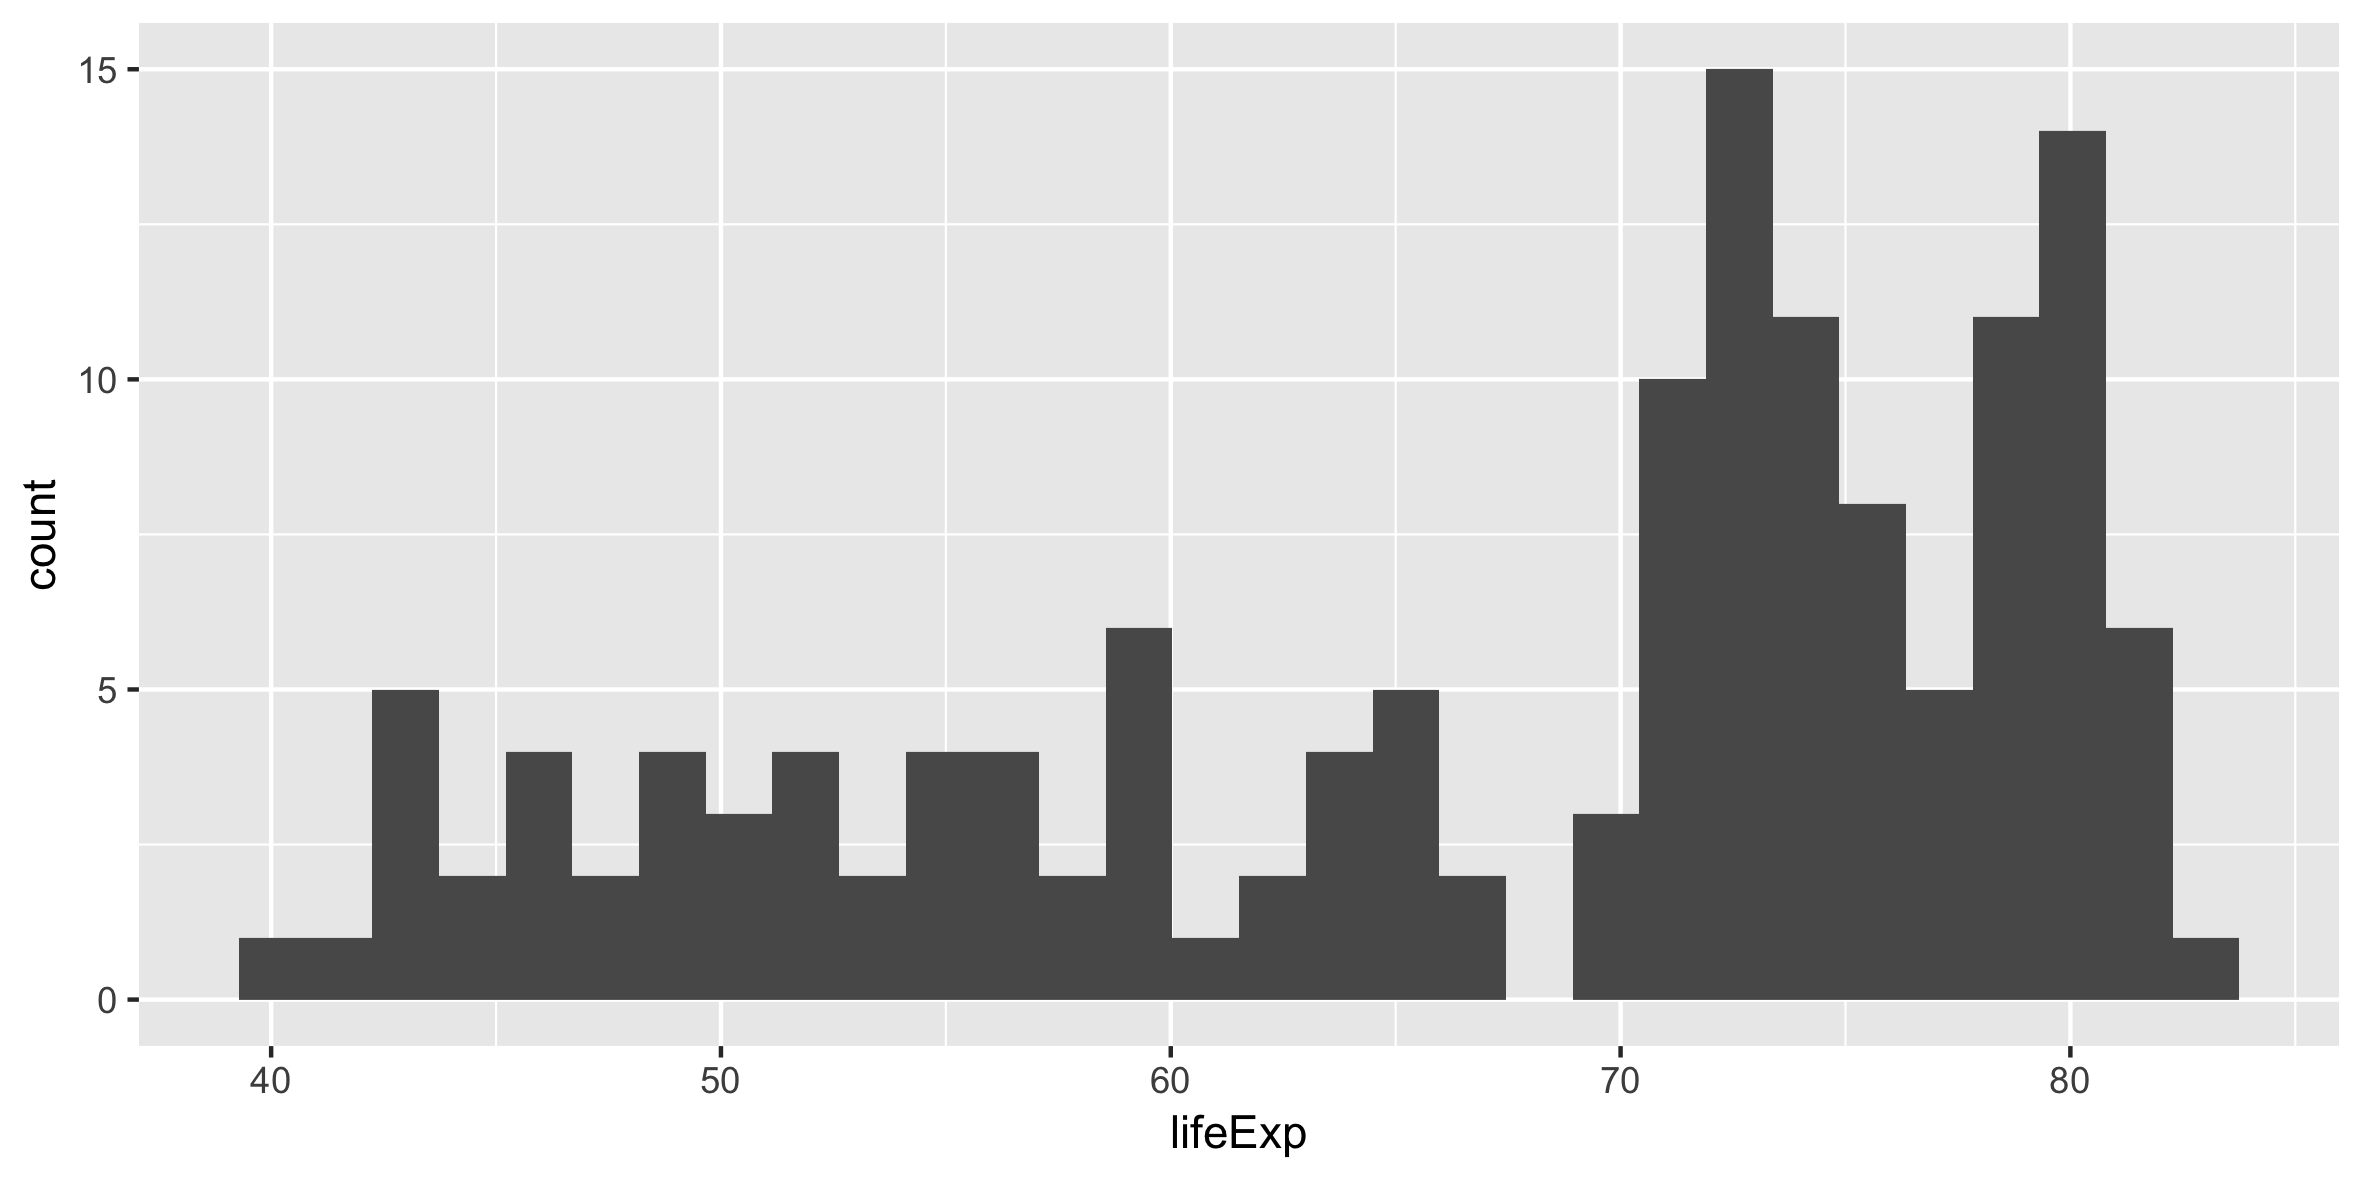
First exploratory plots - distributions
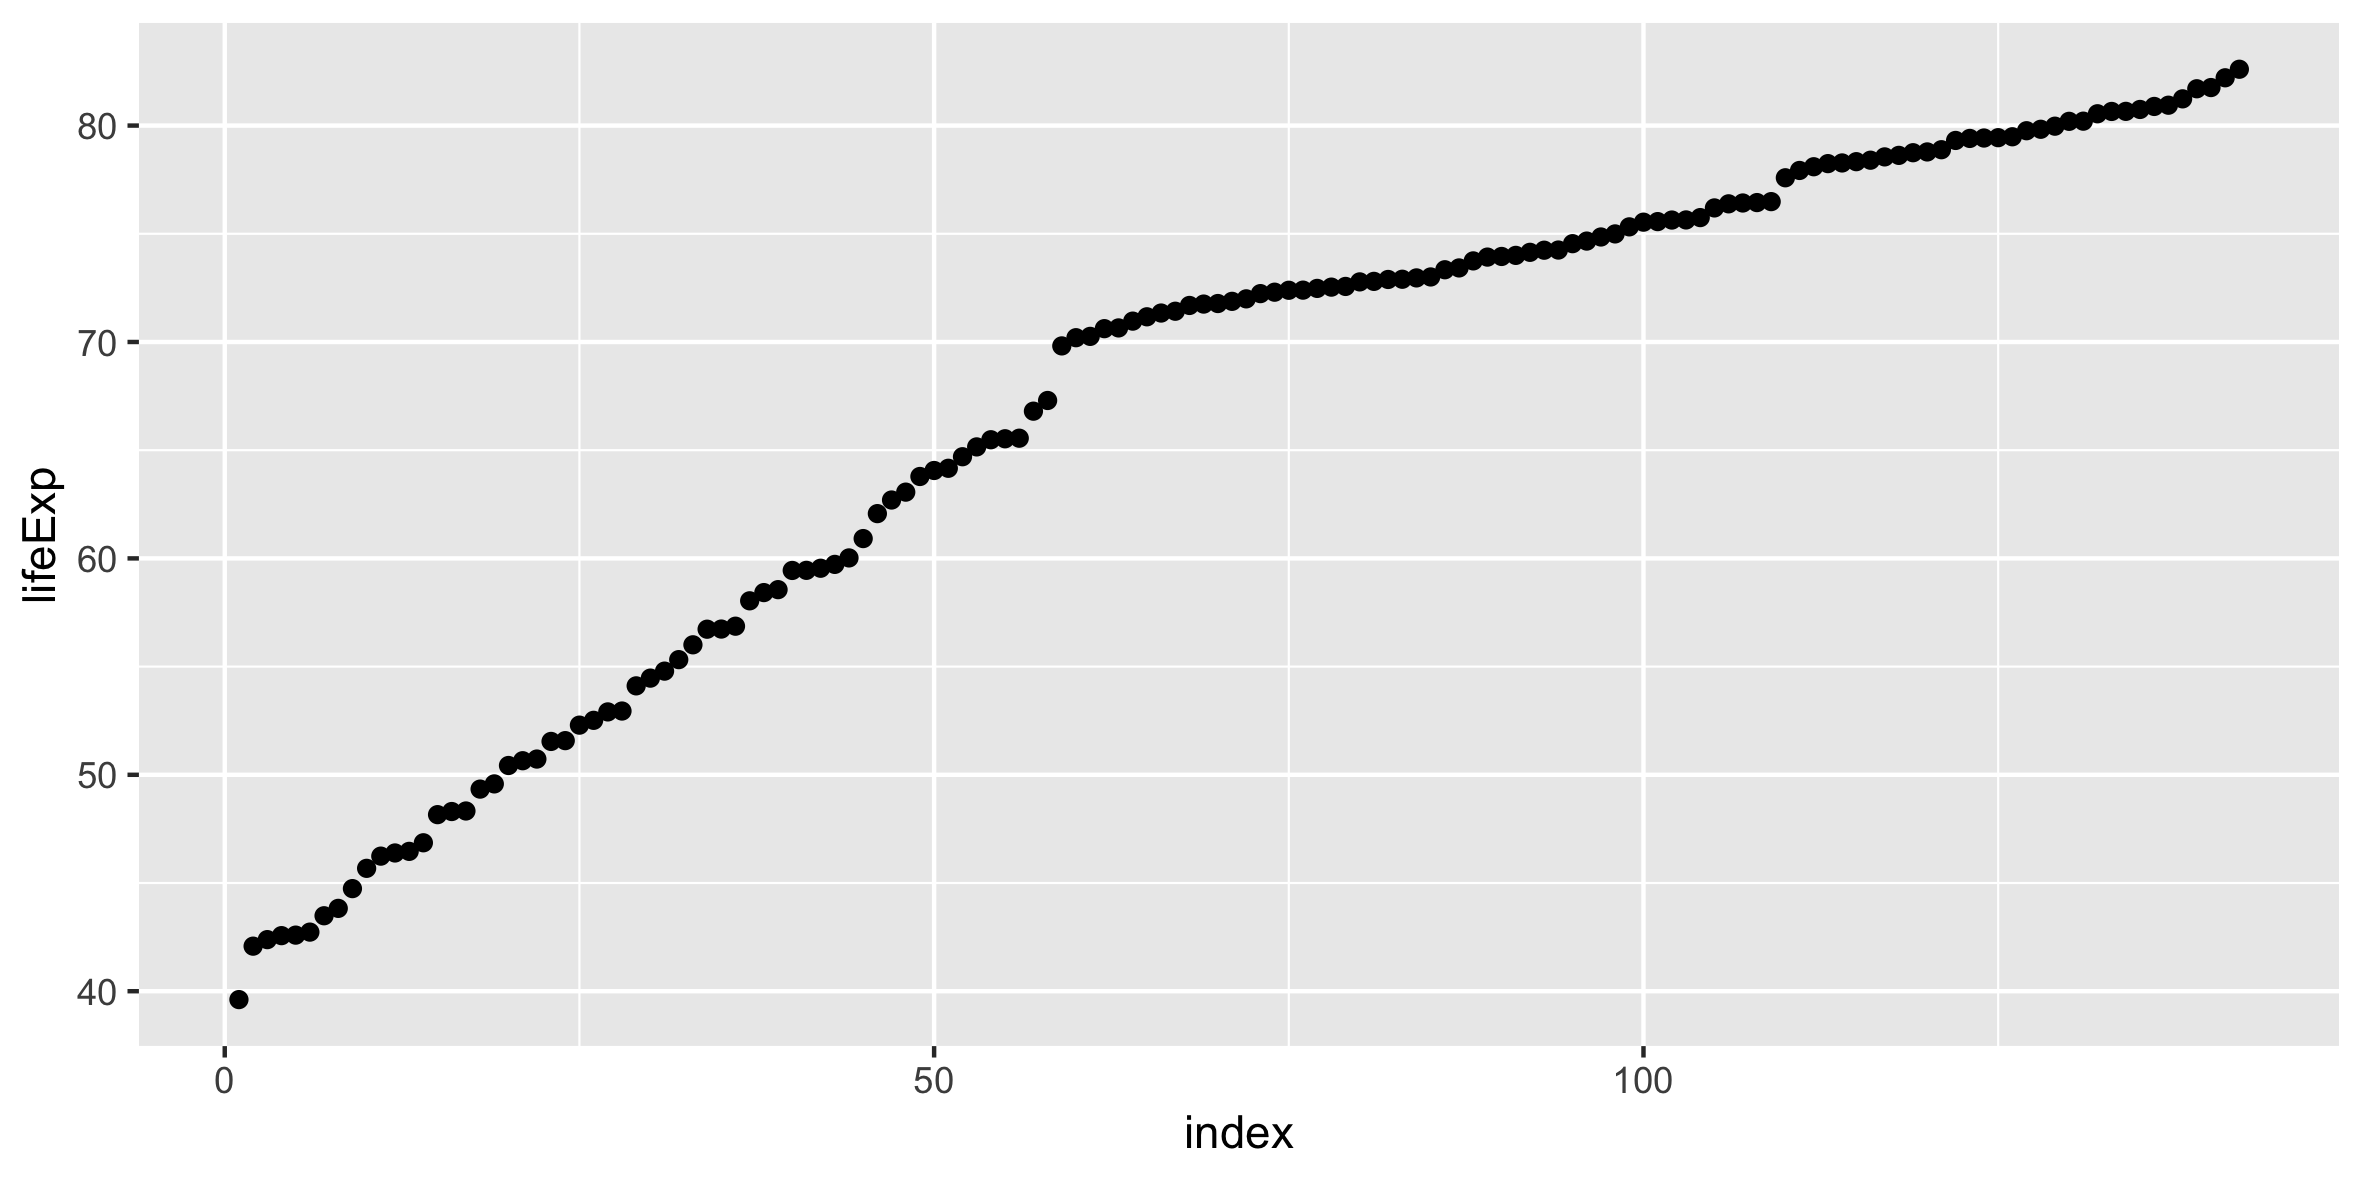
First exploratory plots - distributions
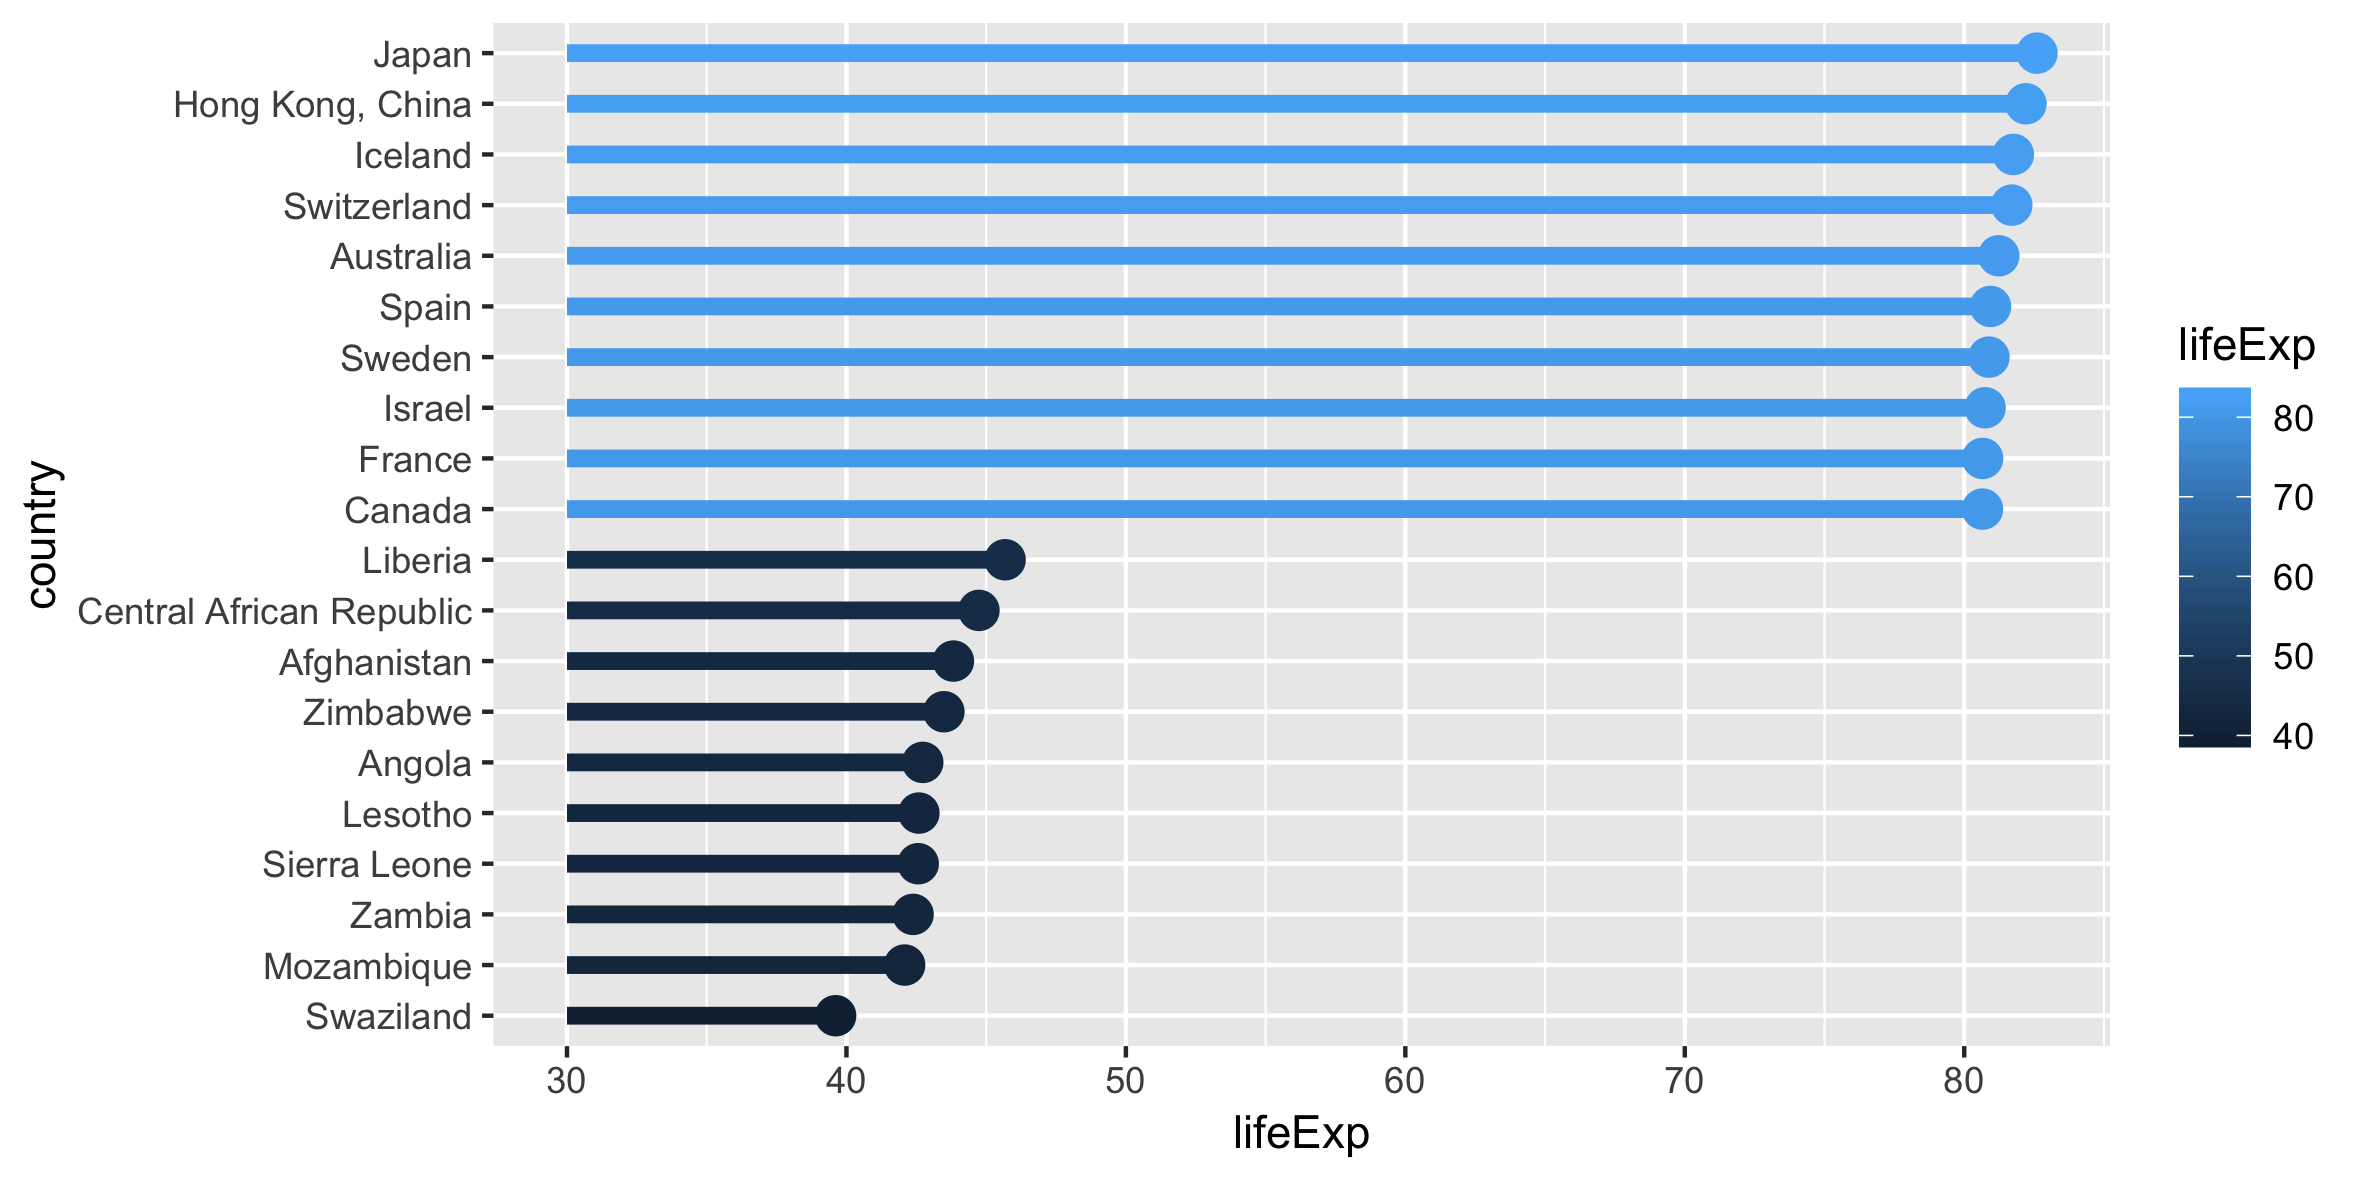
Use intuitive and attractive geoms
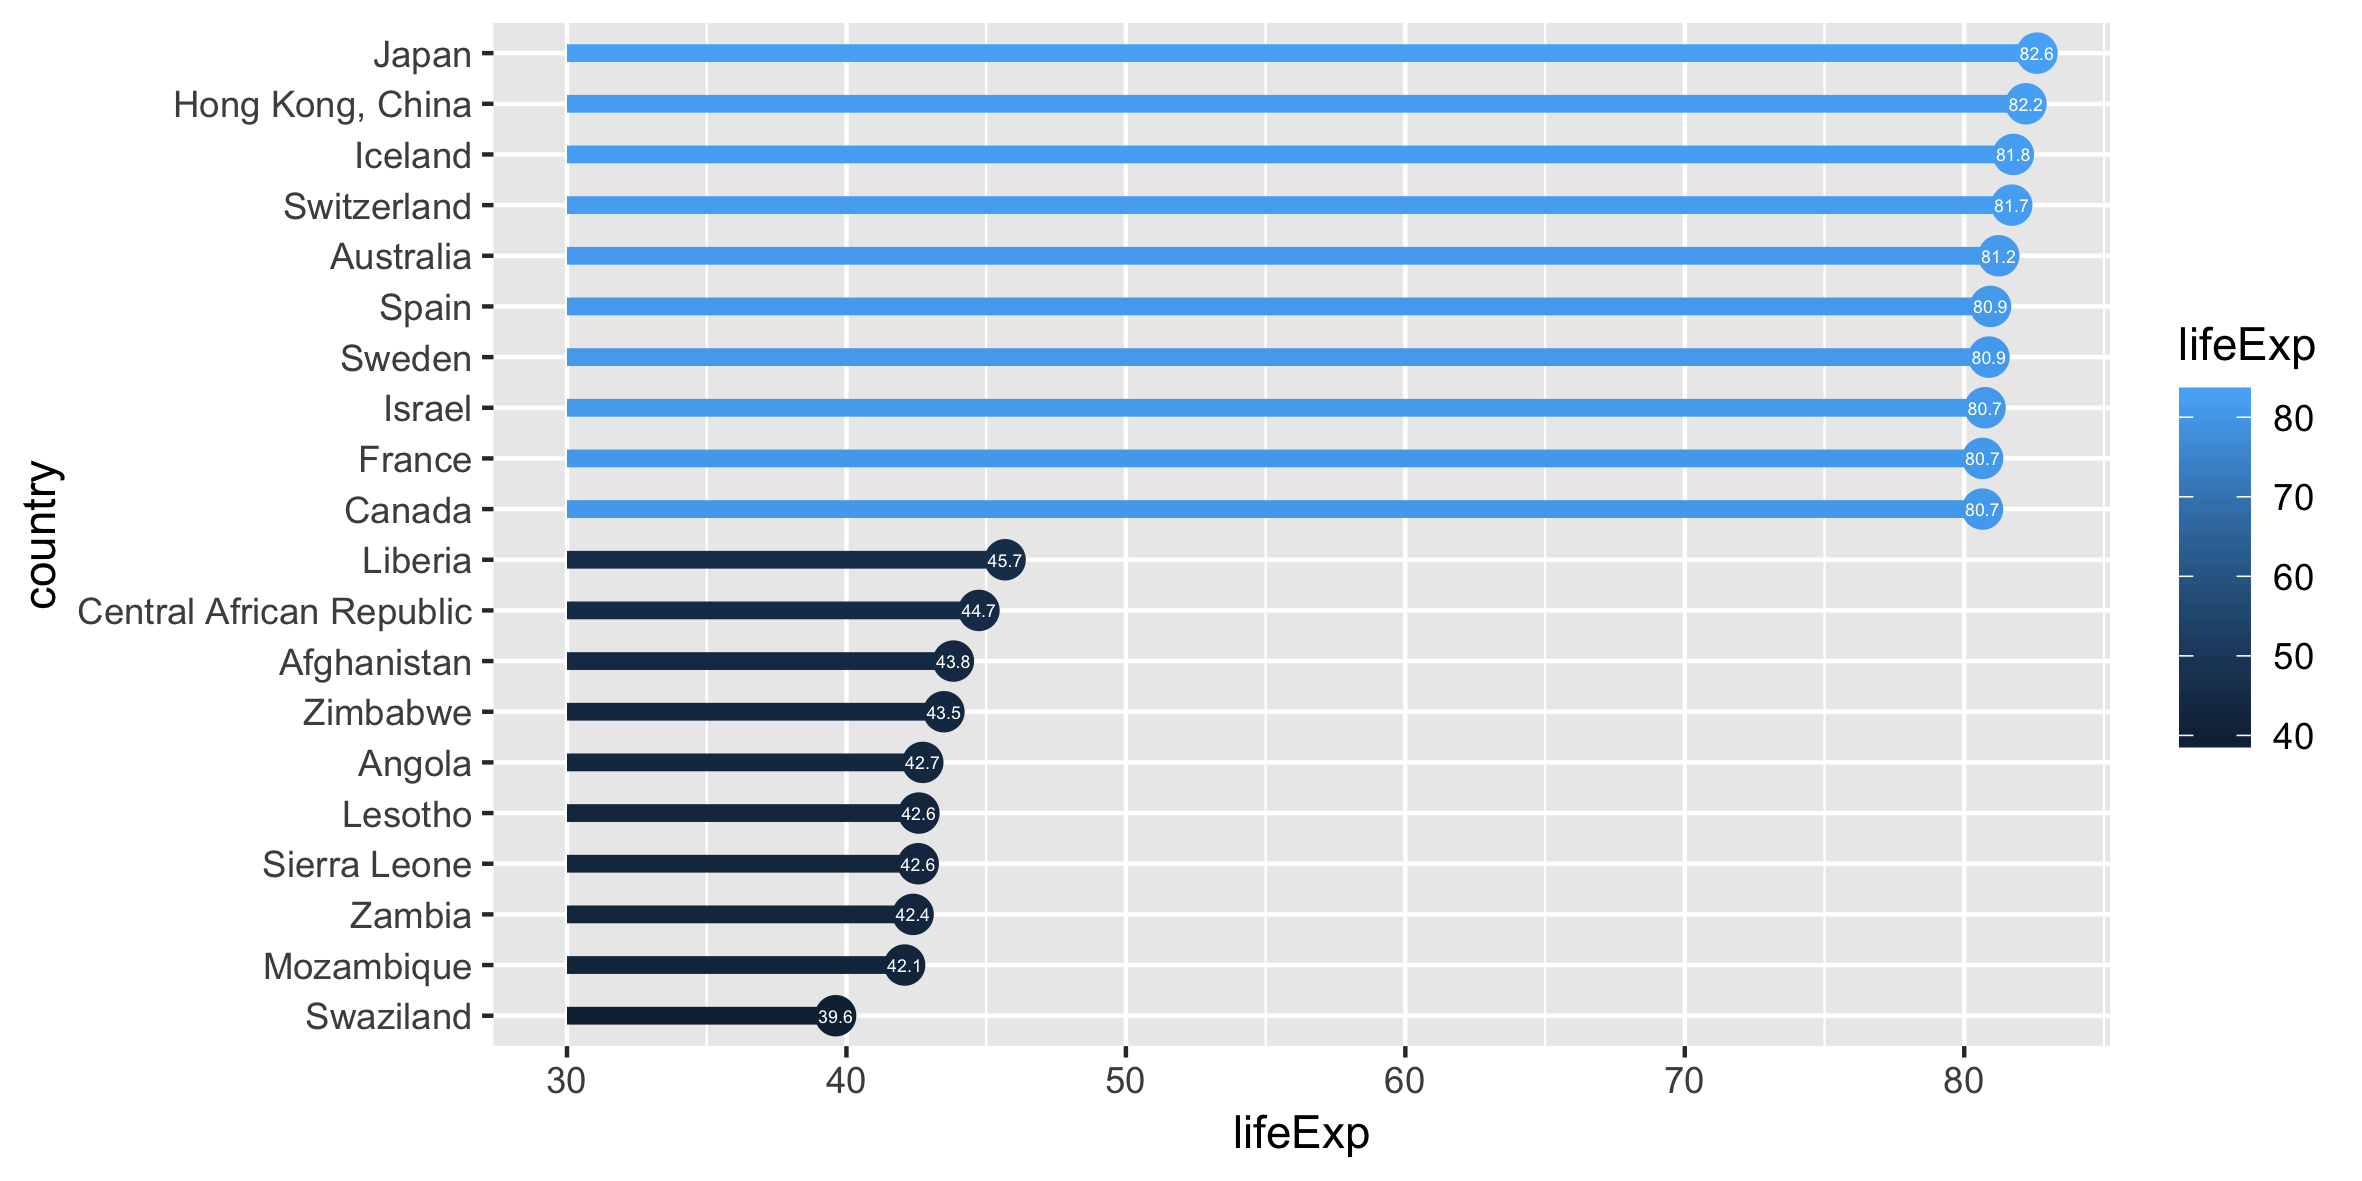
Add text labels to your plot
Use appropriate scales
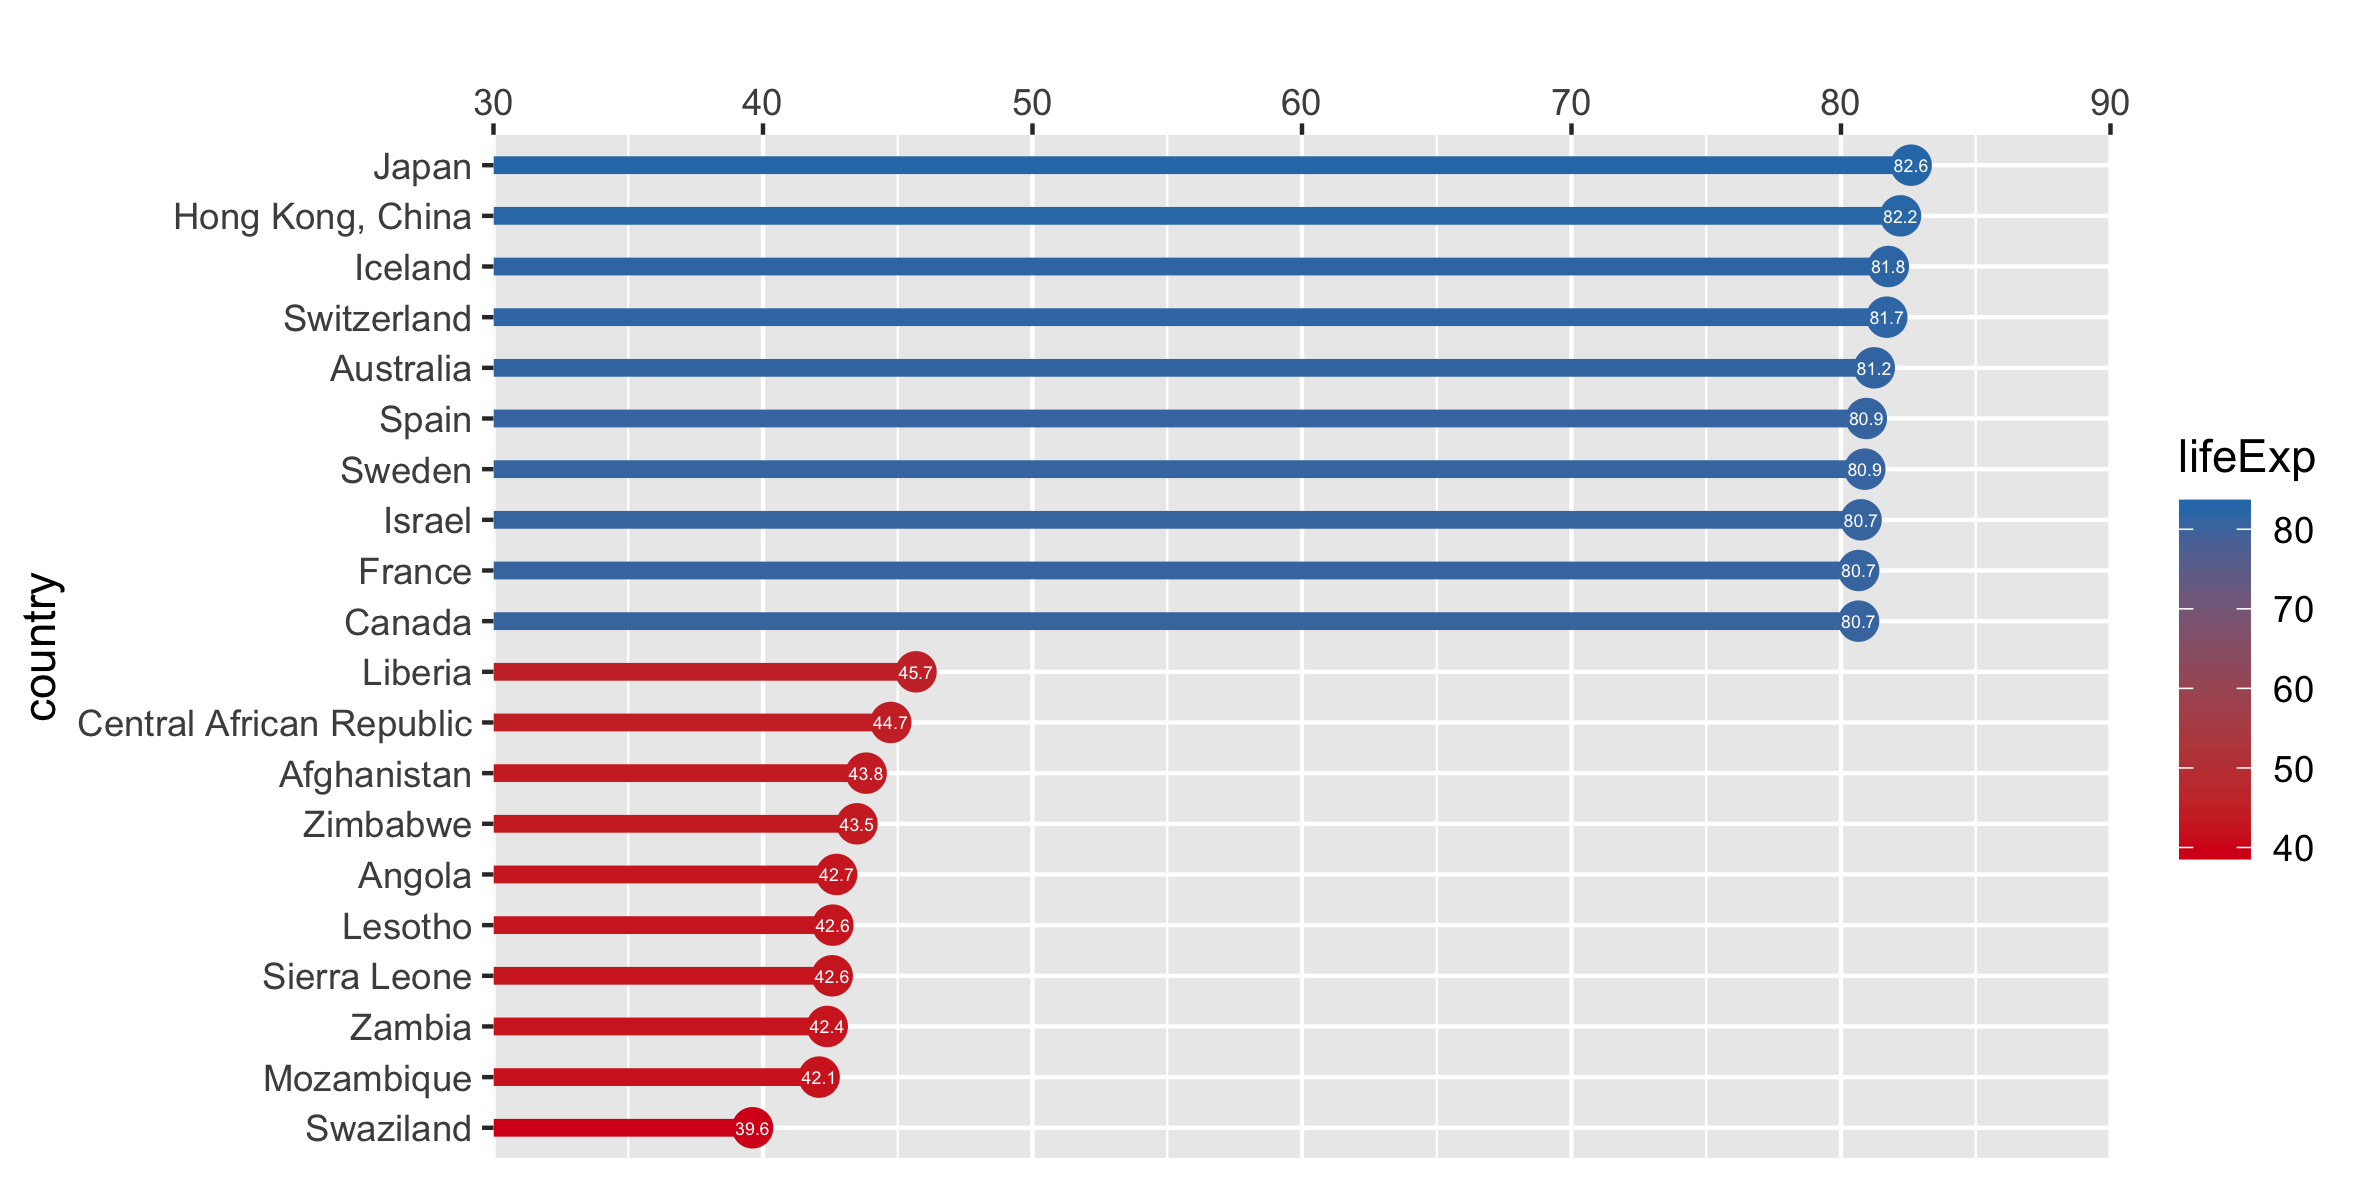
Add useful titles and citations
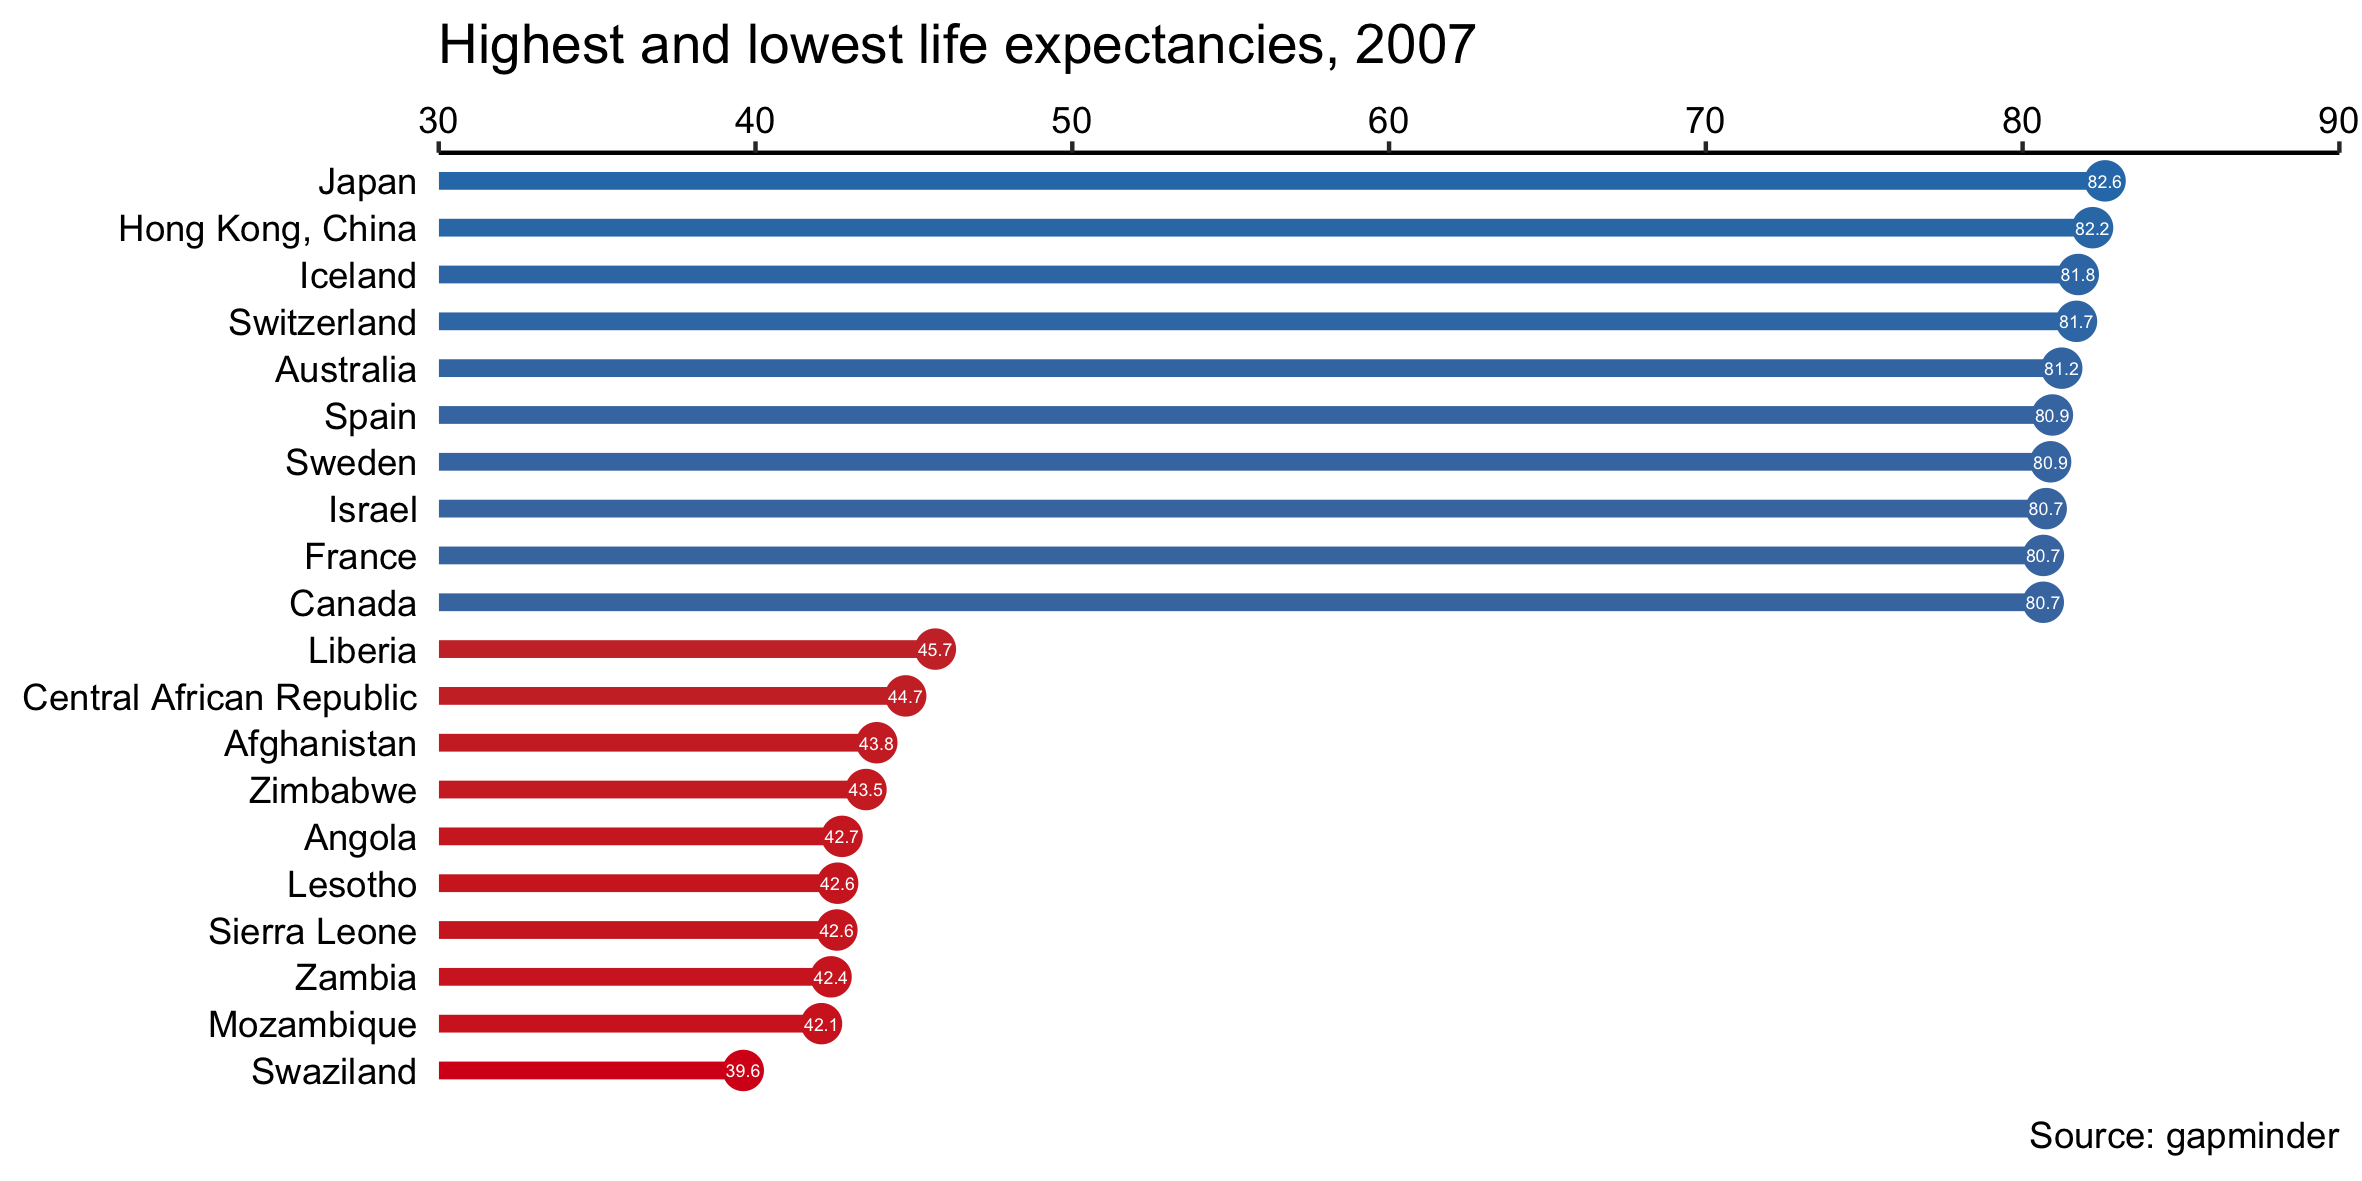
Remove non-data ink
Add threshold lines

Add informative text
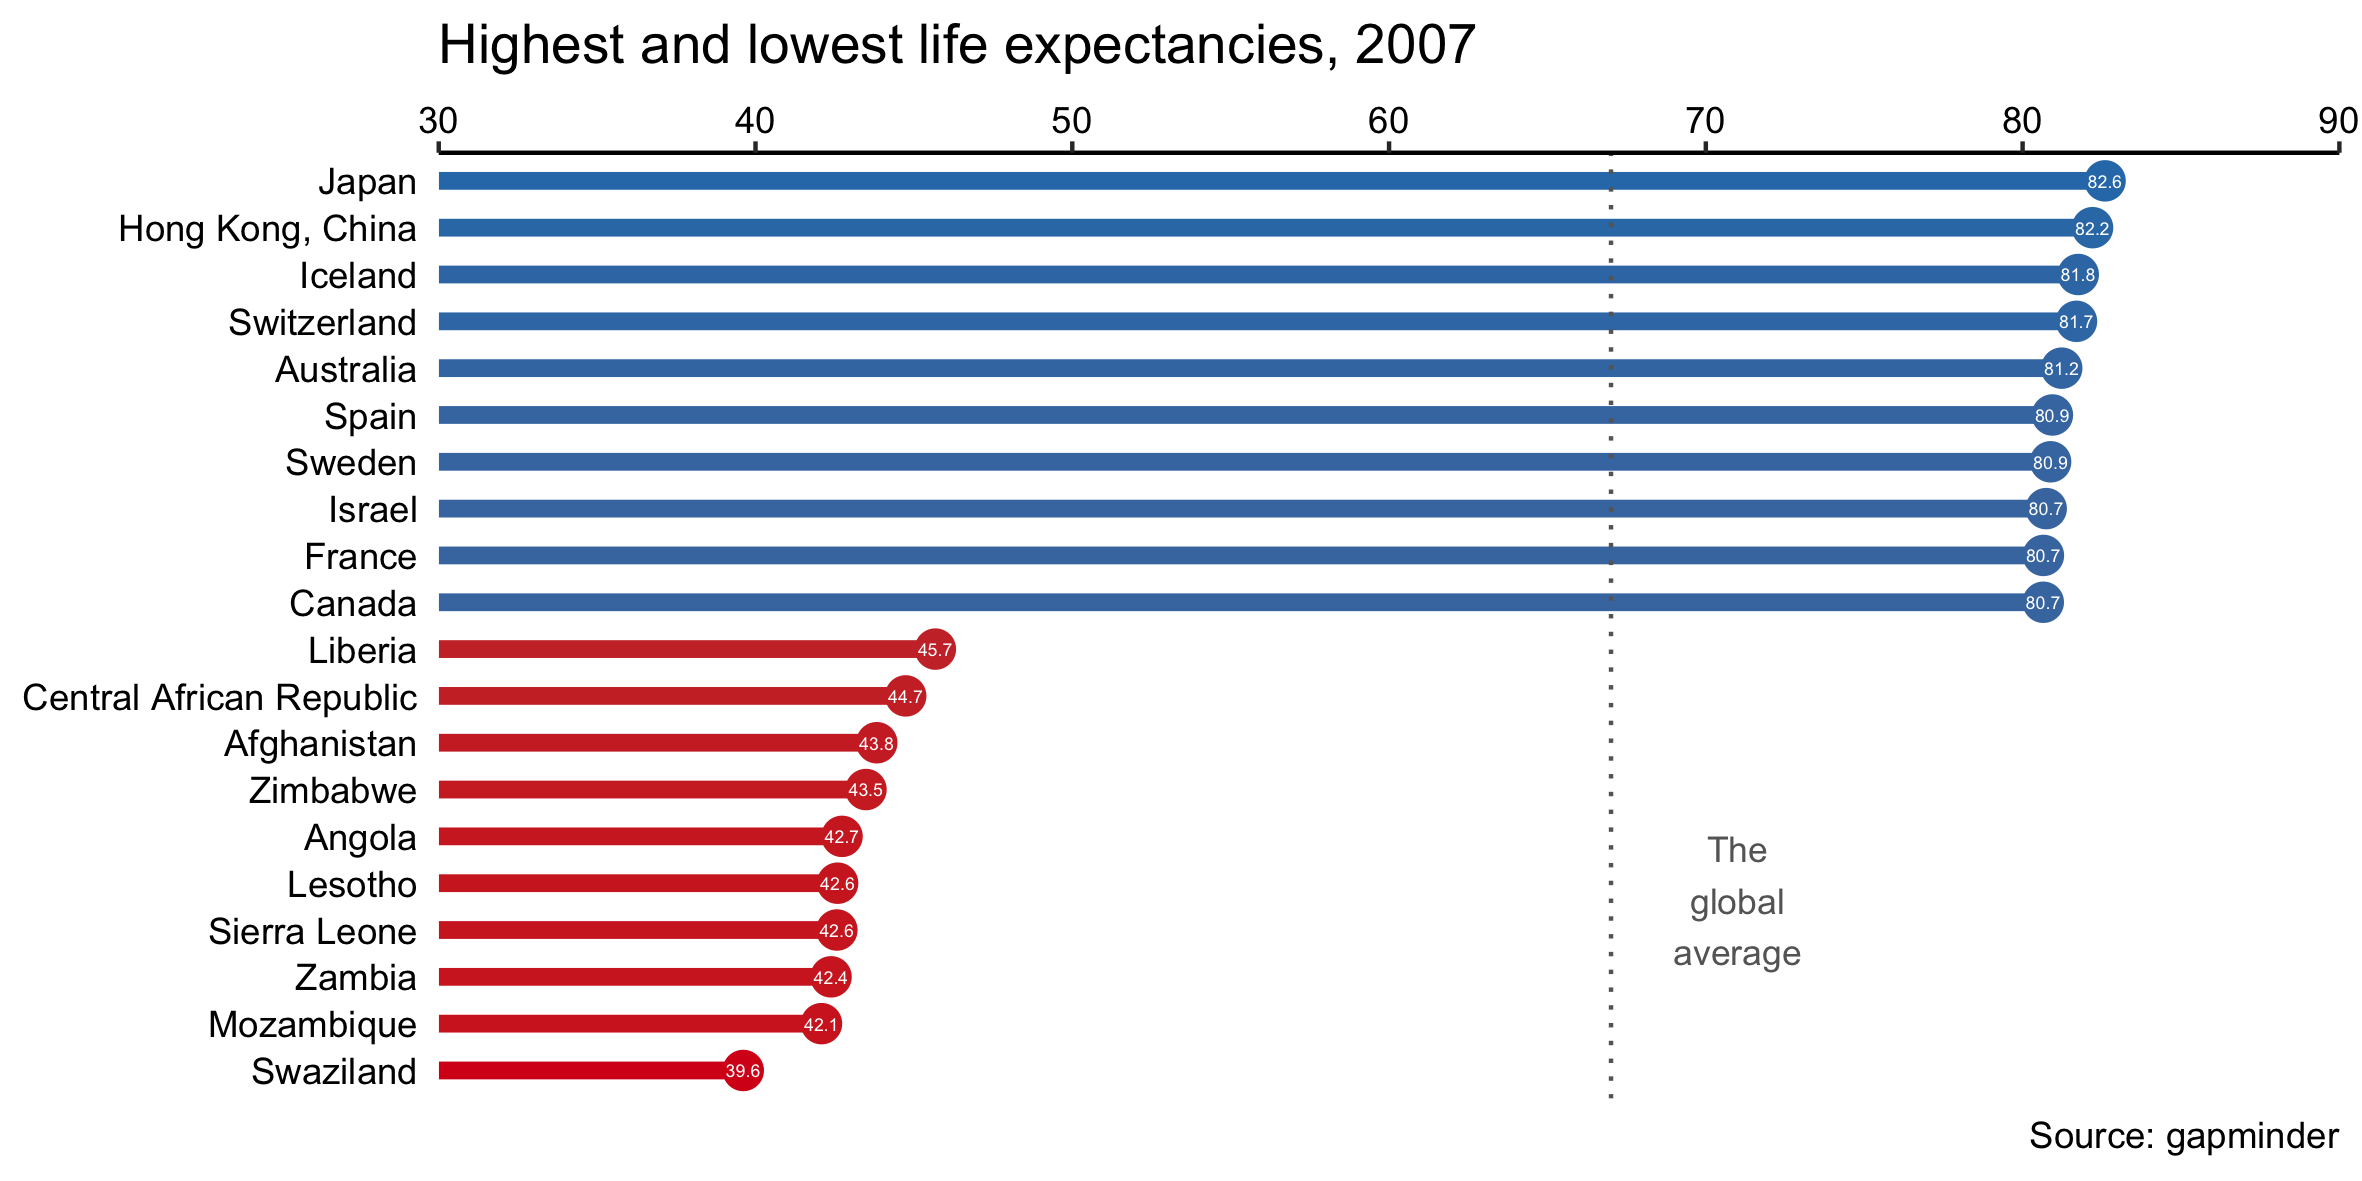
Add embellishments

