Themes from scratch
Introduction to Data Visualization with ggplot2

Rick Scavetta
Founder, Scavetta Academy
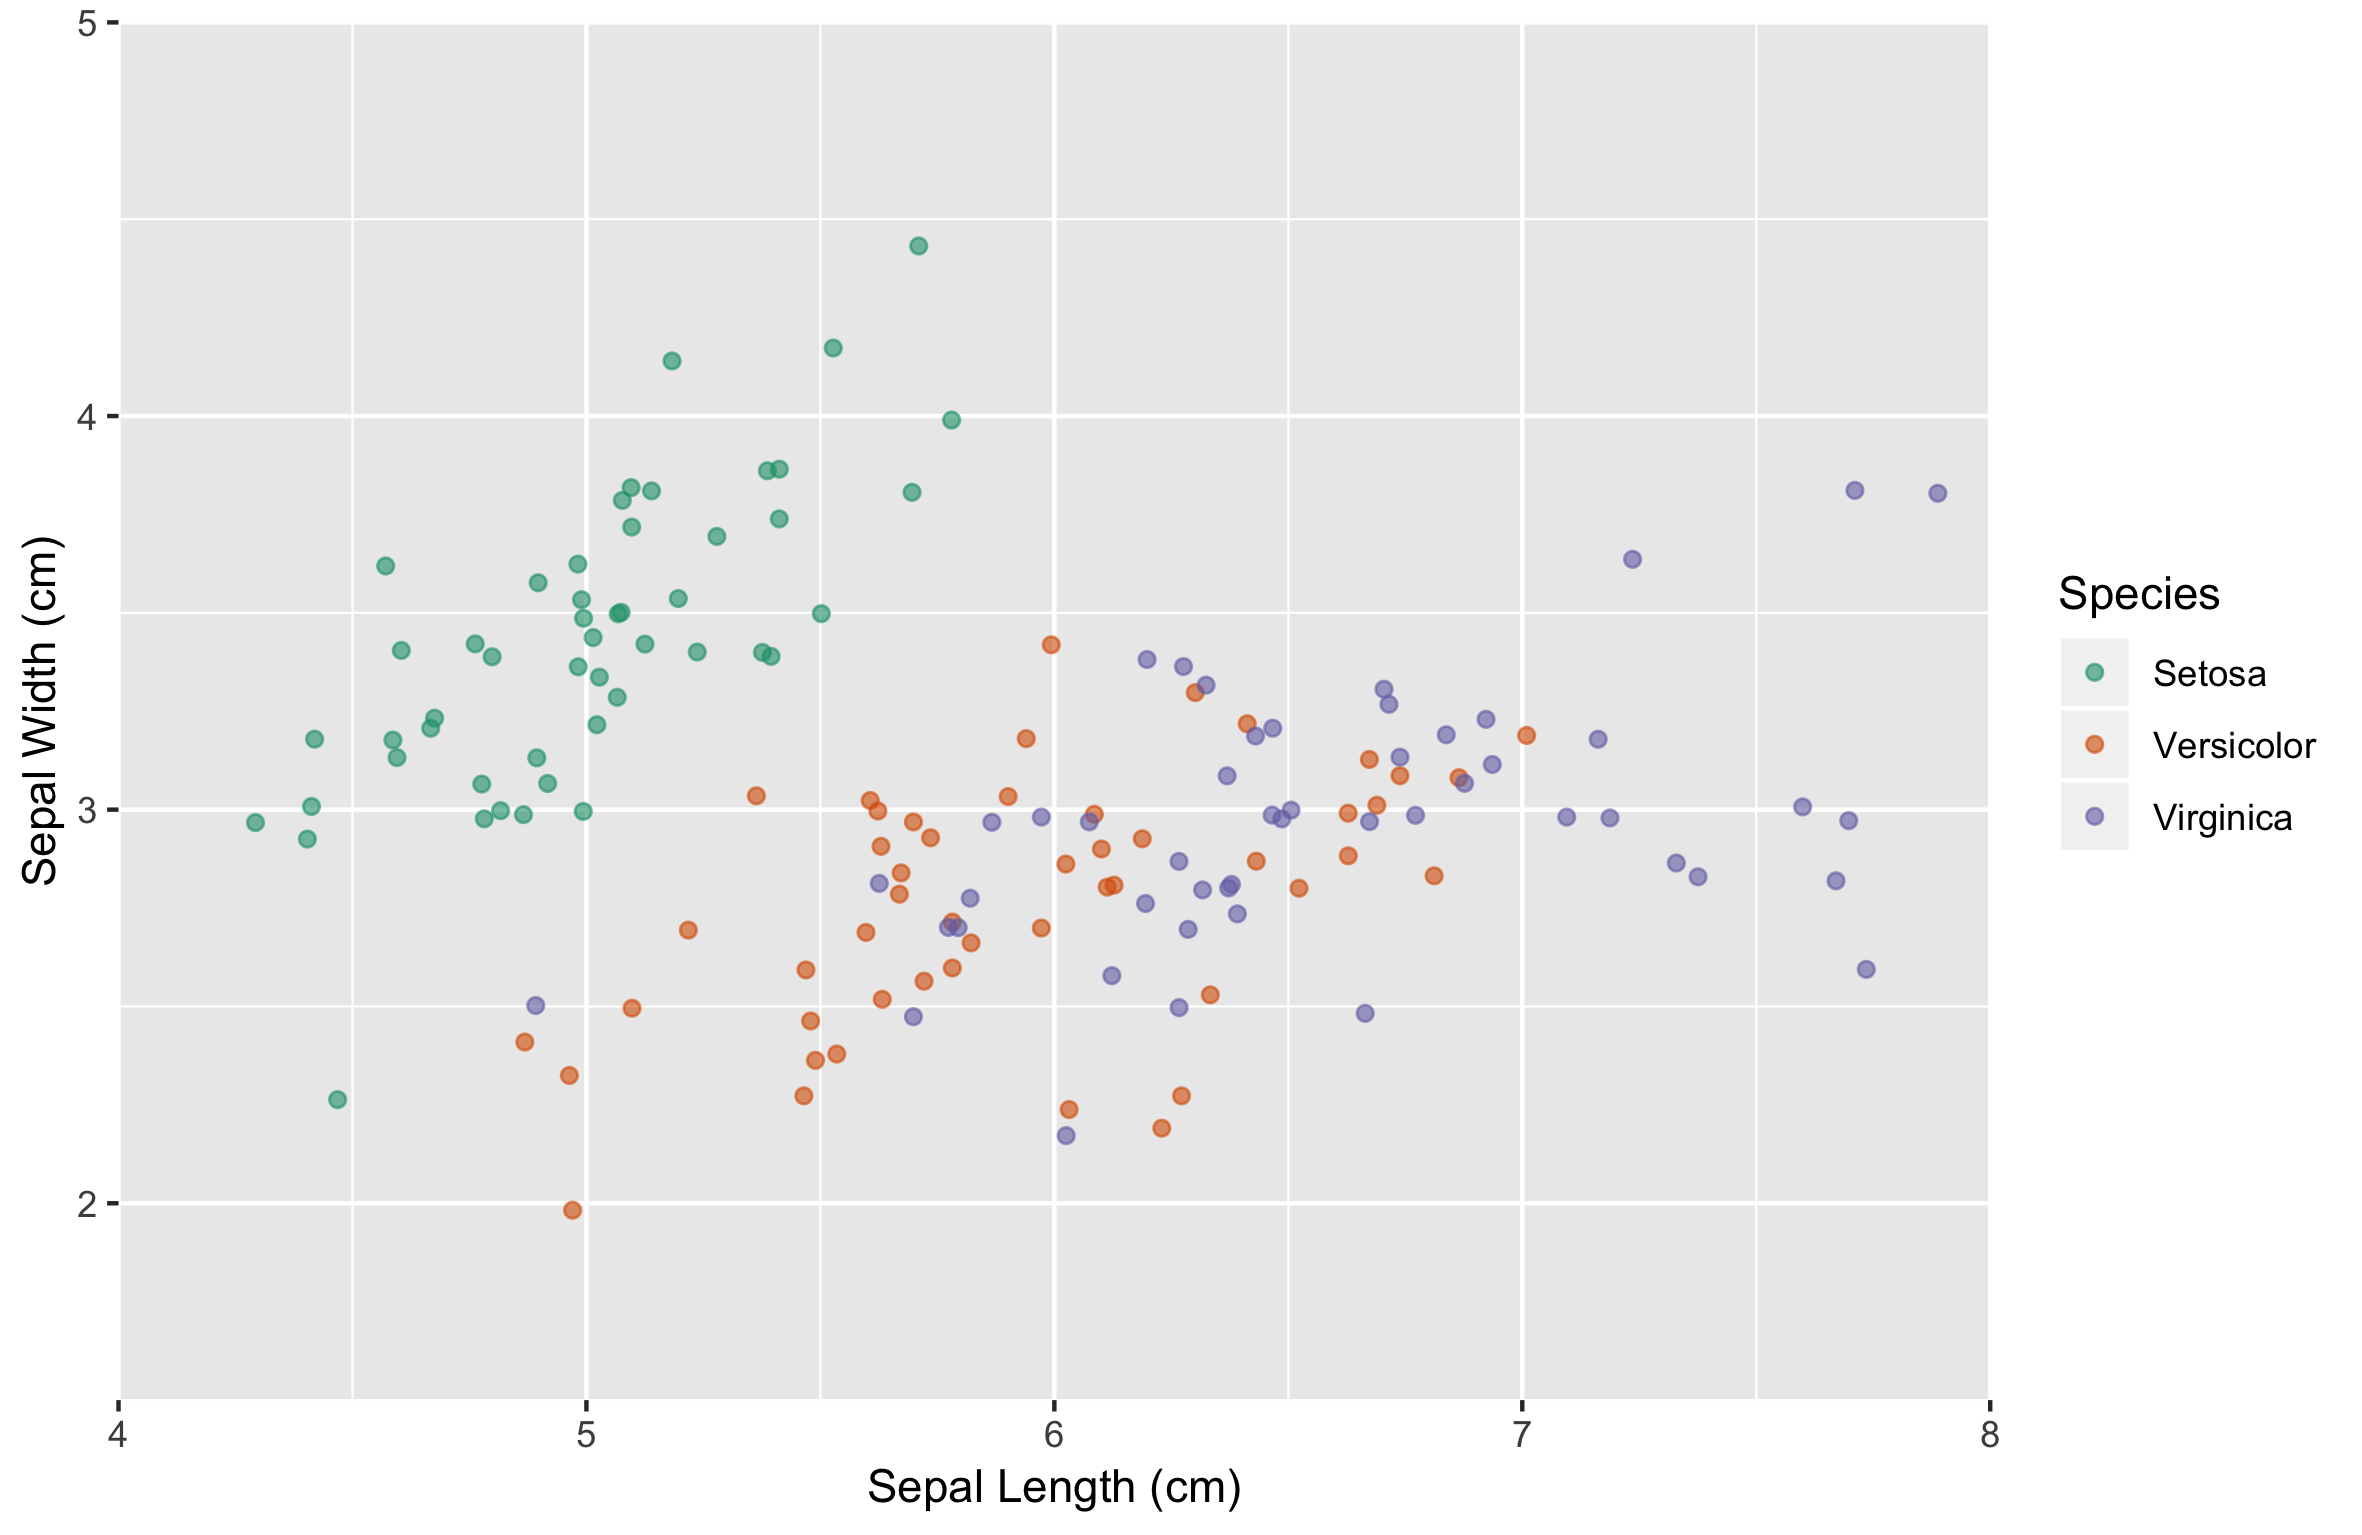
A starting plot...
ggplot(iris, aes(x = Sepal.Length, y = Sepal.Width, color = Species)) +
  geom_jitter(alpha = 0.6)
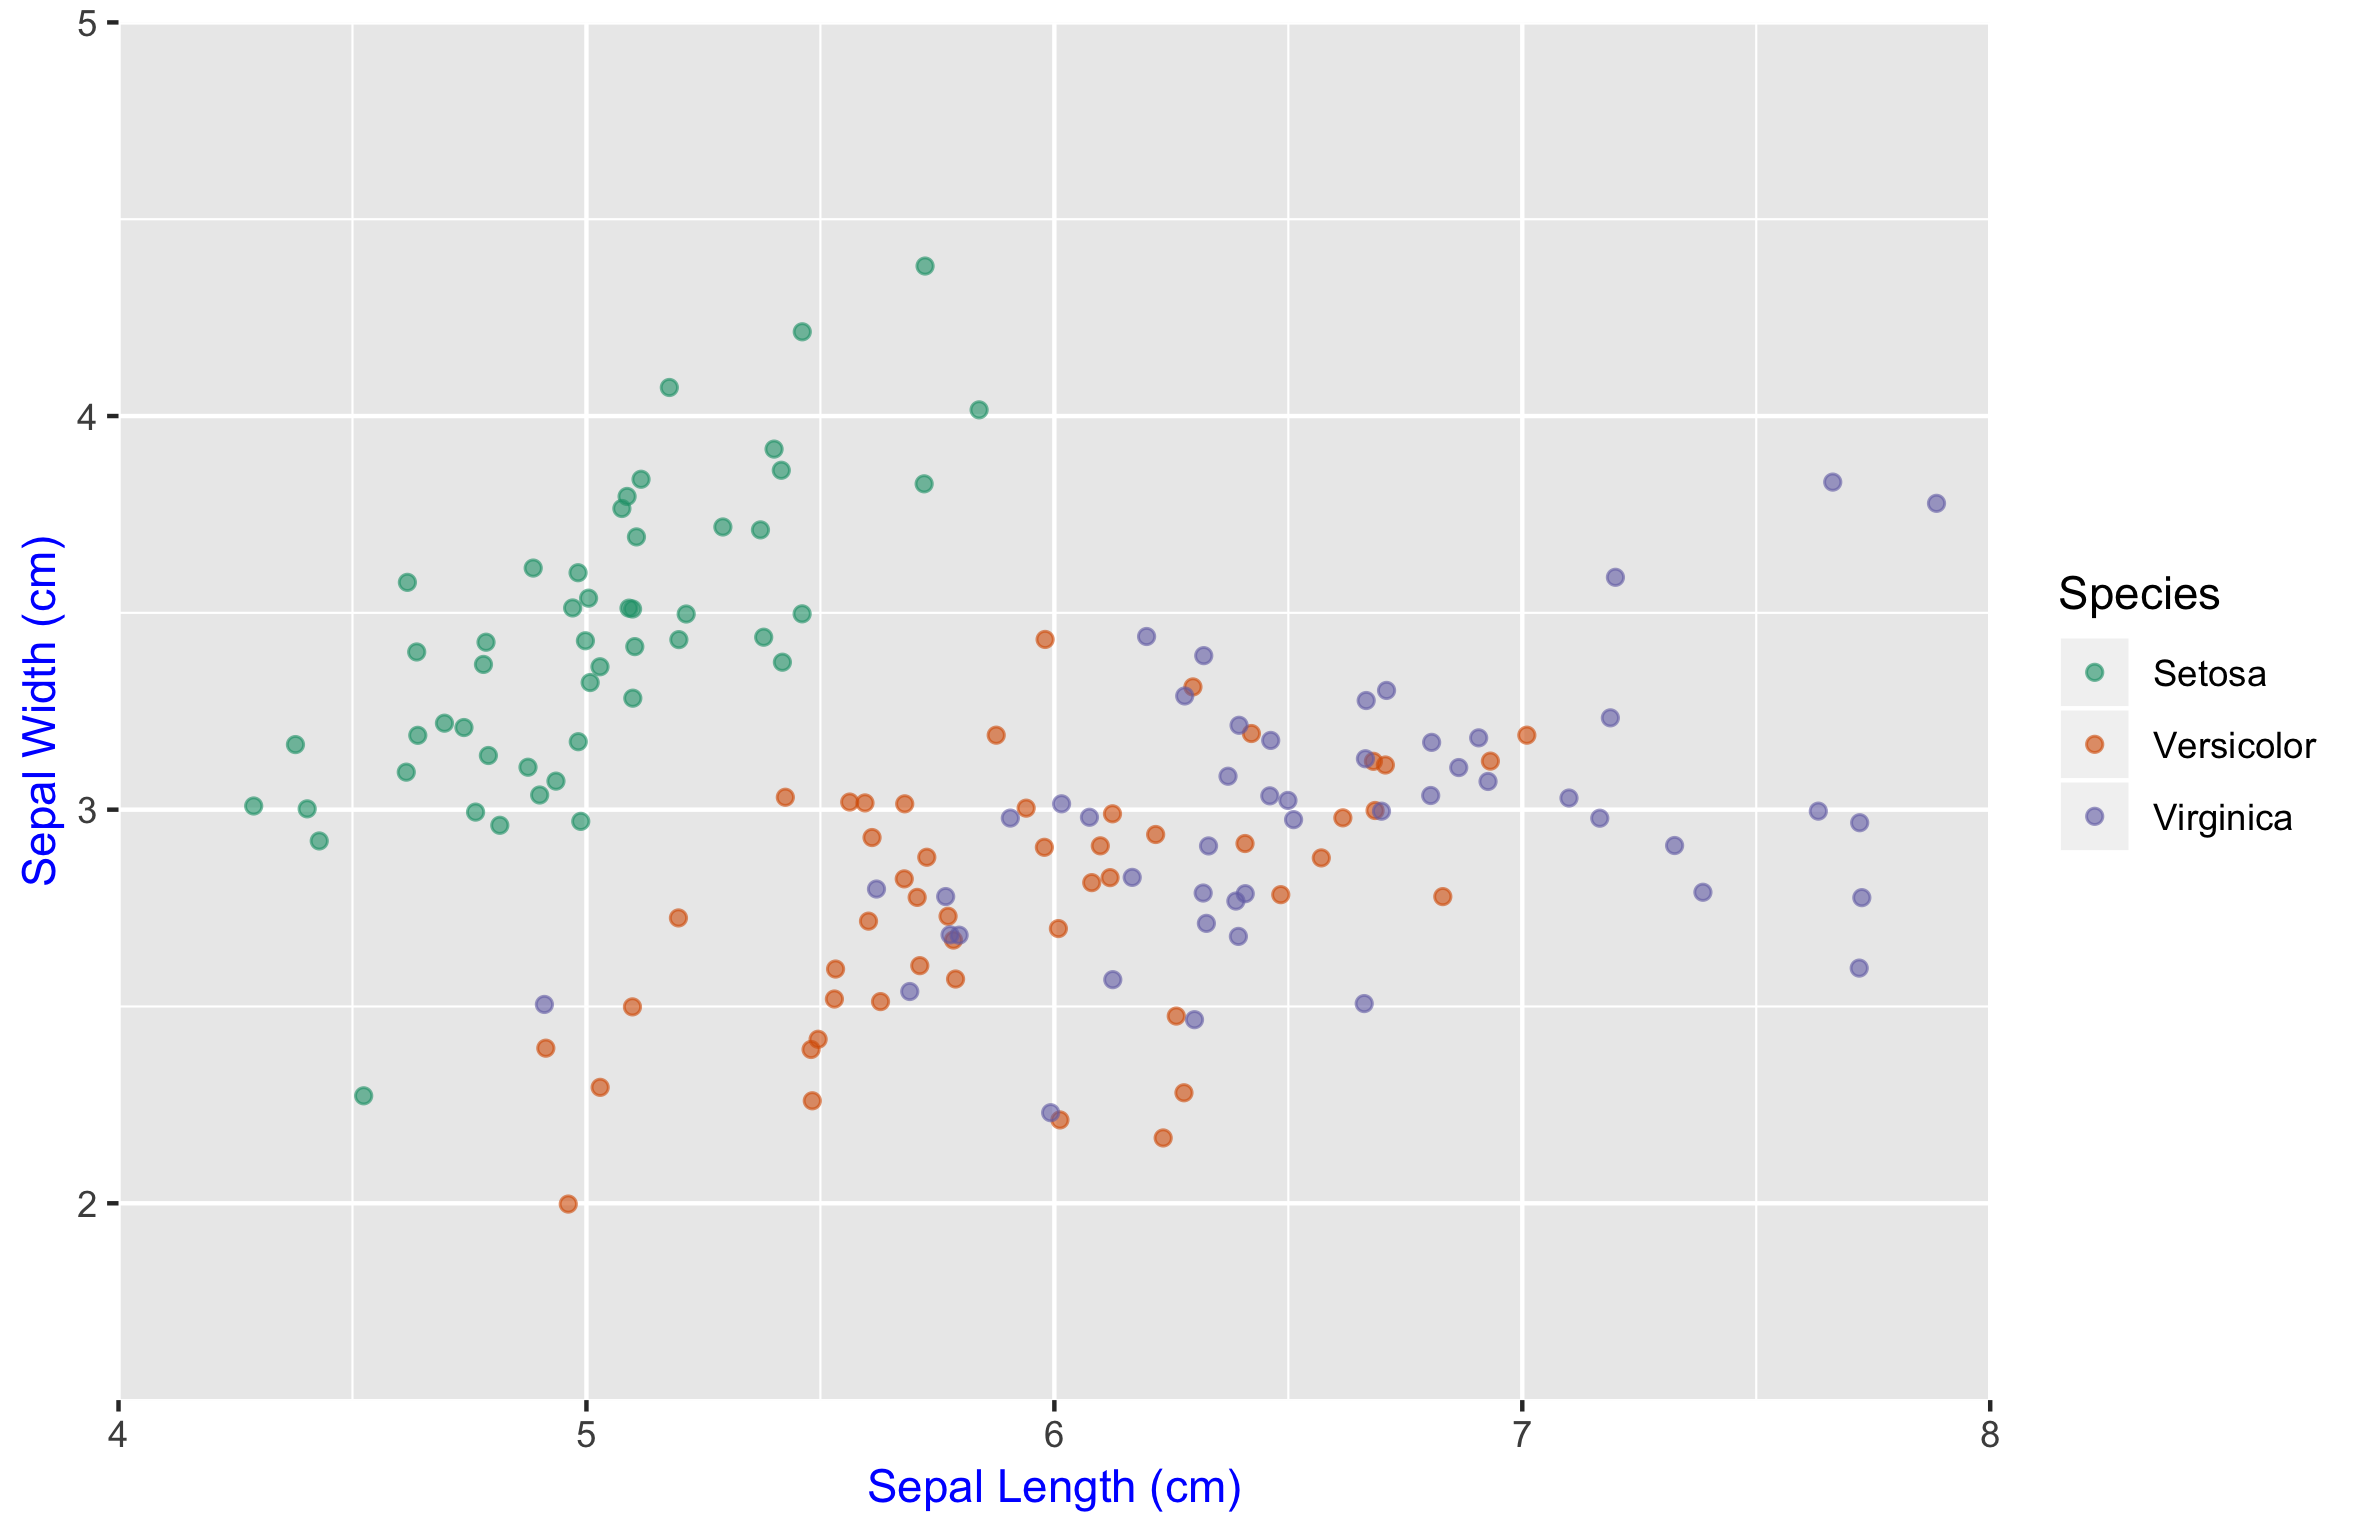
The text elements
The text elements
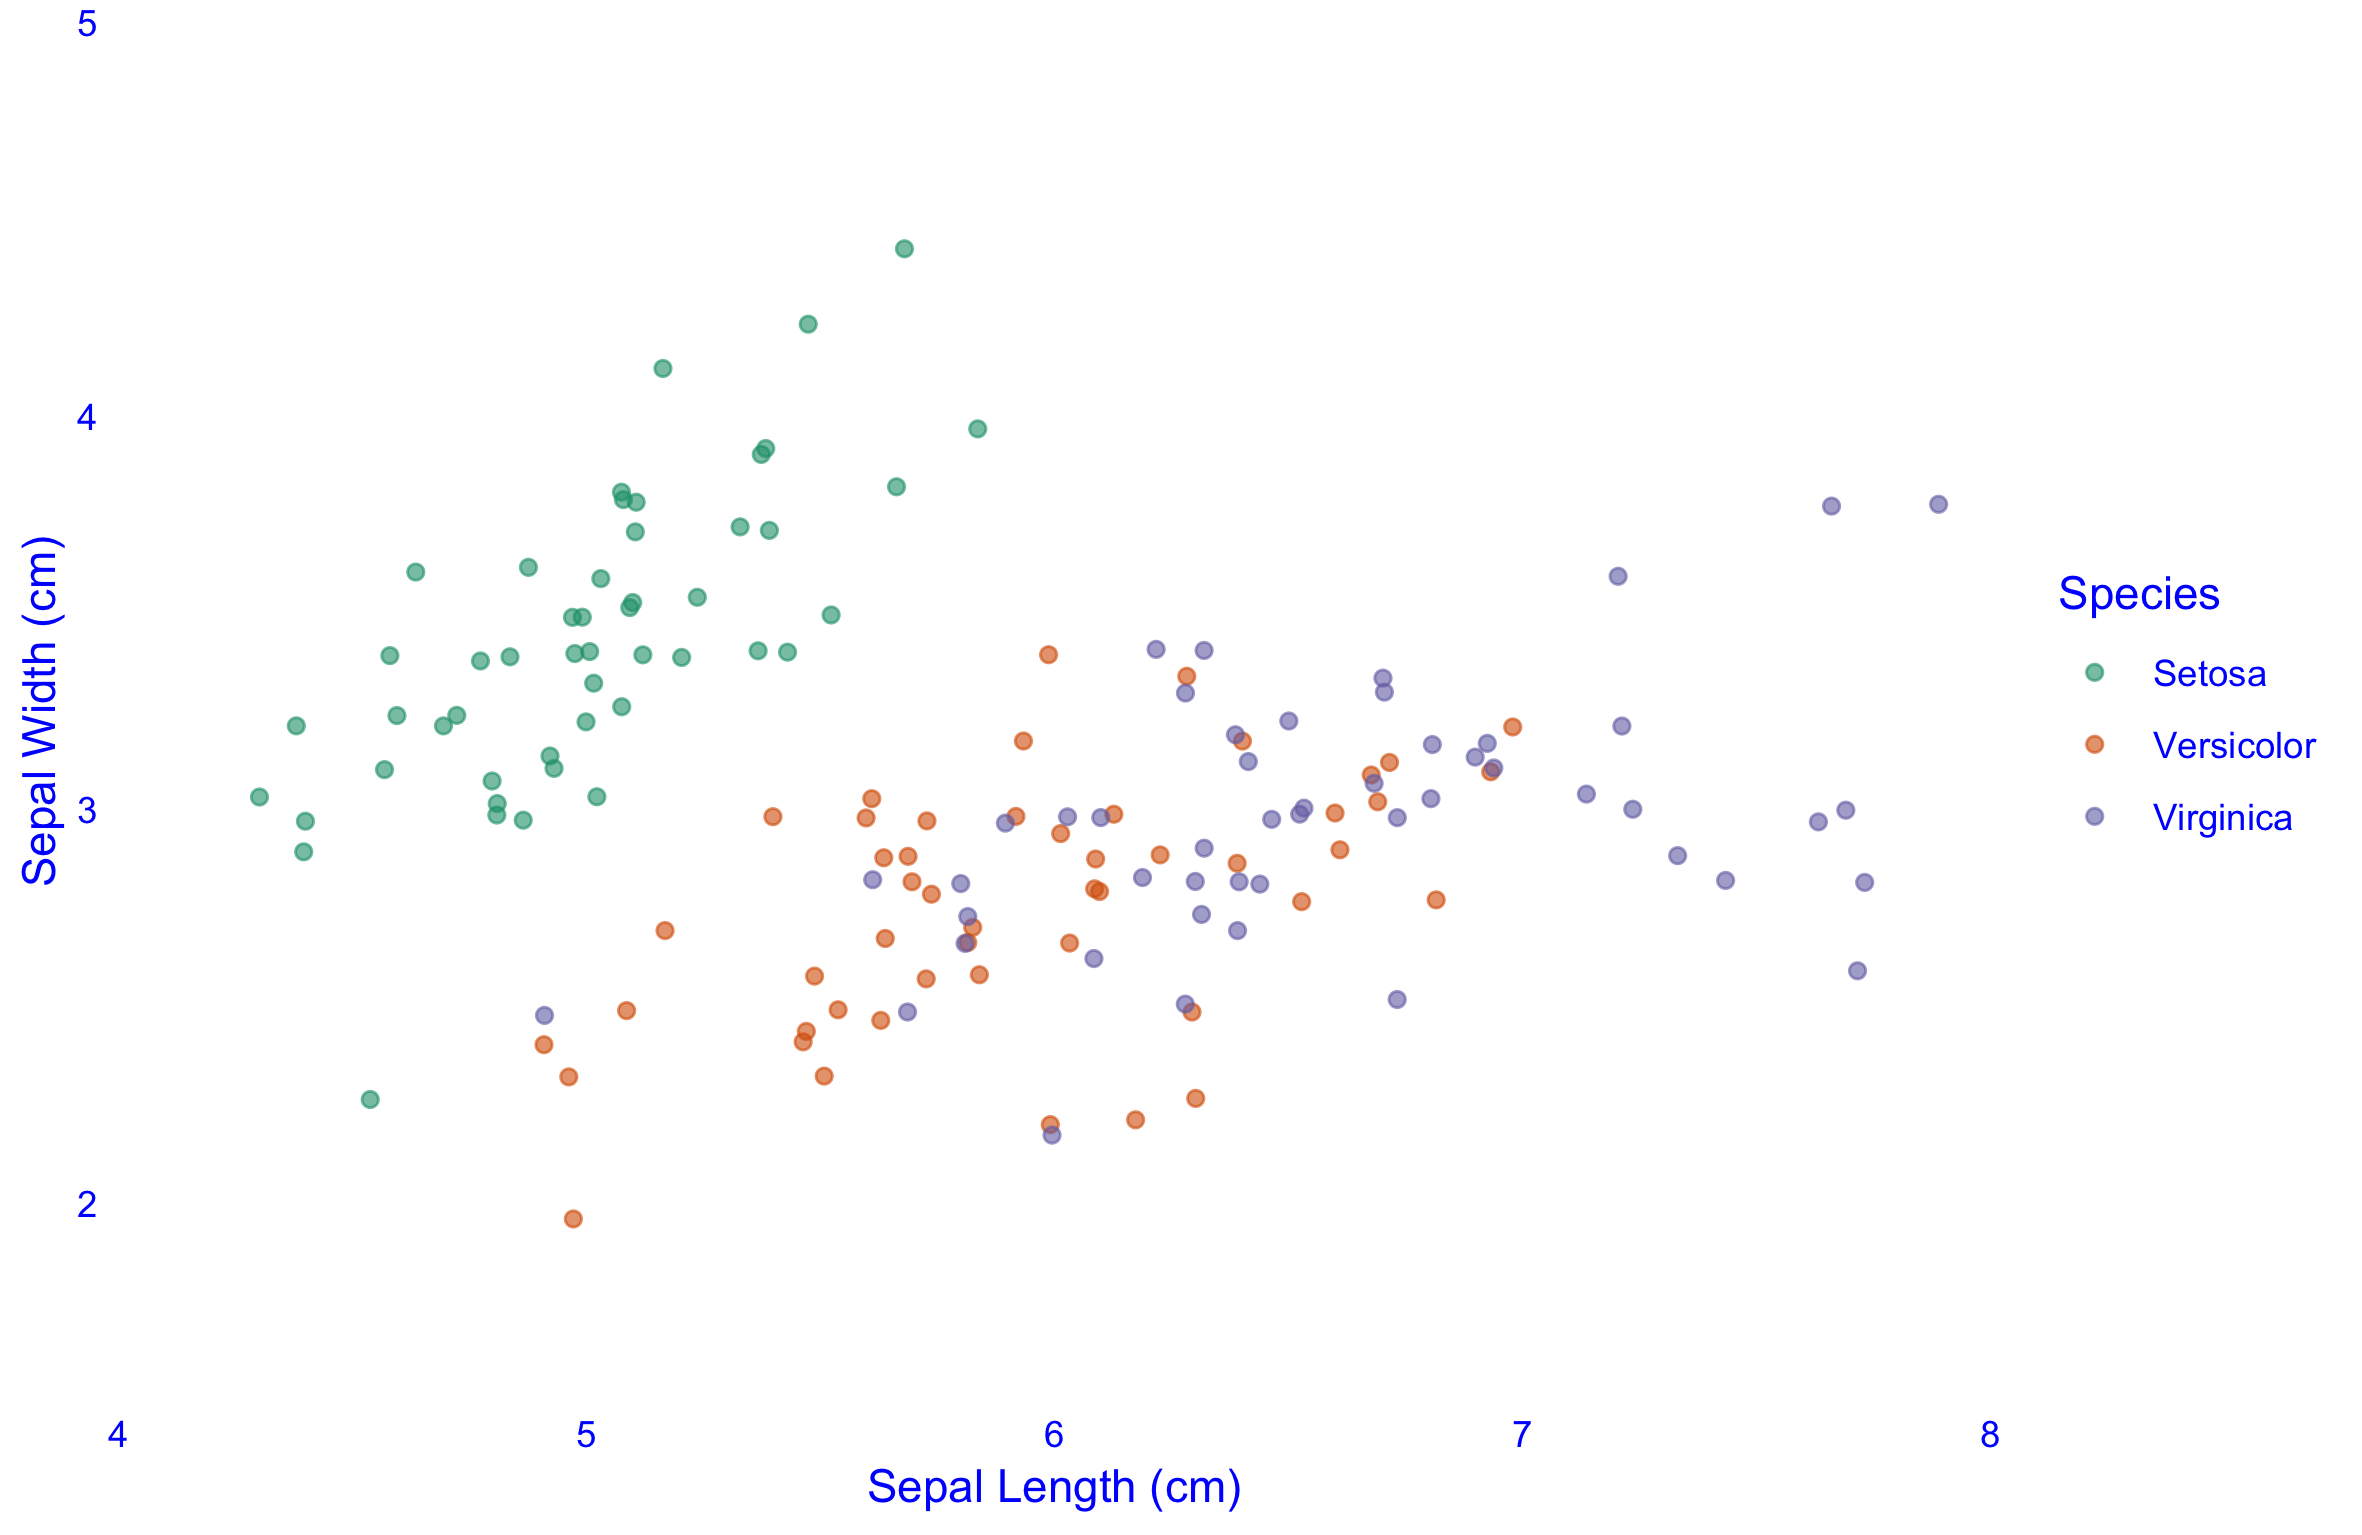
Adjusting theme elements
ggplot(iris, aes(x = Sepal.Length, y = Sepal.Width, color = Species)) +
  geom_jitter(alpha = 0.6) +
  theme(axis.title = element_text(color = "blue"))
A starting plot...
ggplot(iris, aes(x = Sepal.Length, y = Sepal.Width, color = Species)) +
  geom_jitter(alpha = 0.6)
Line elements
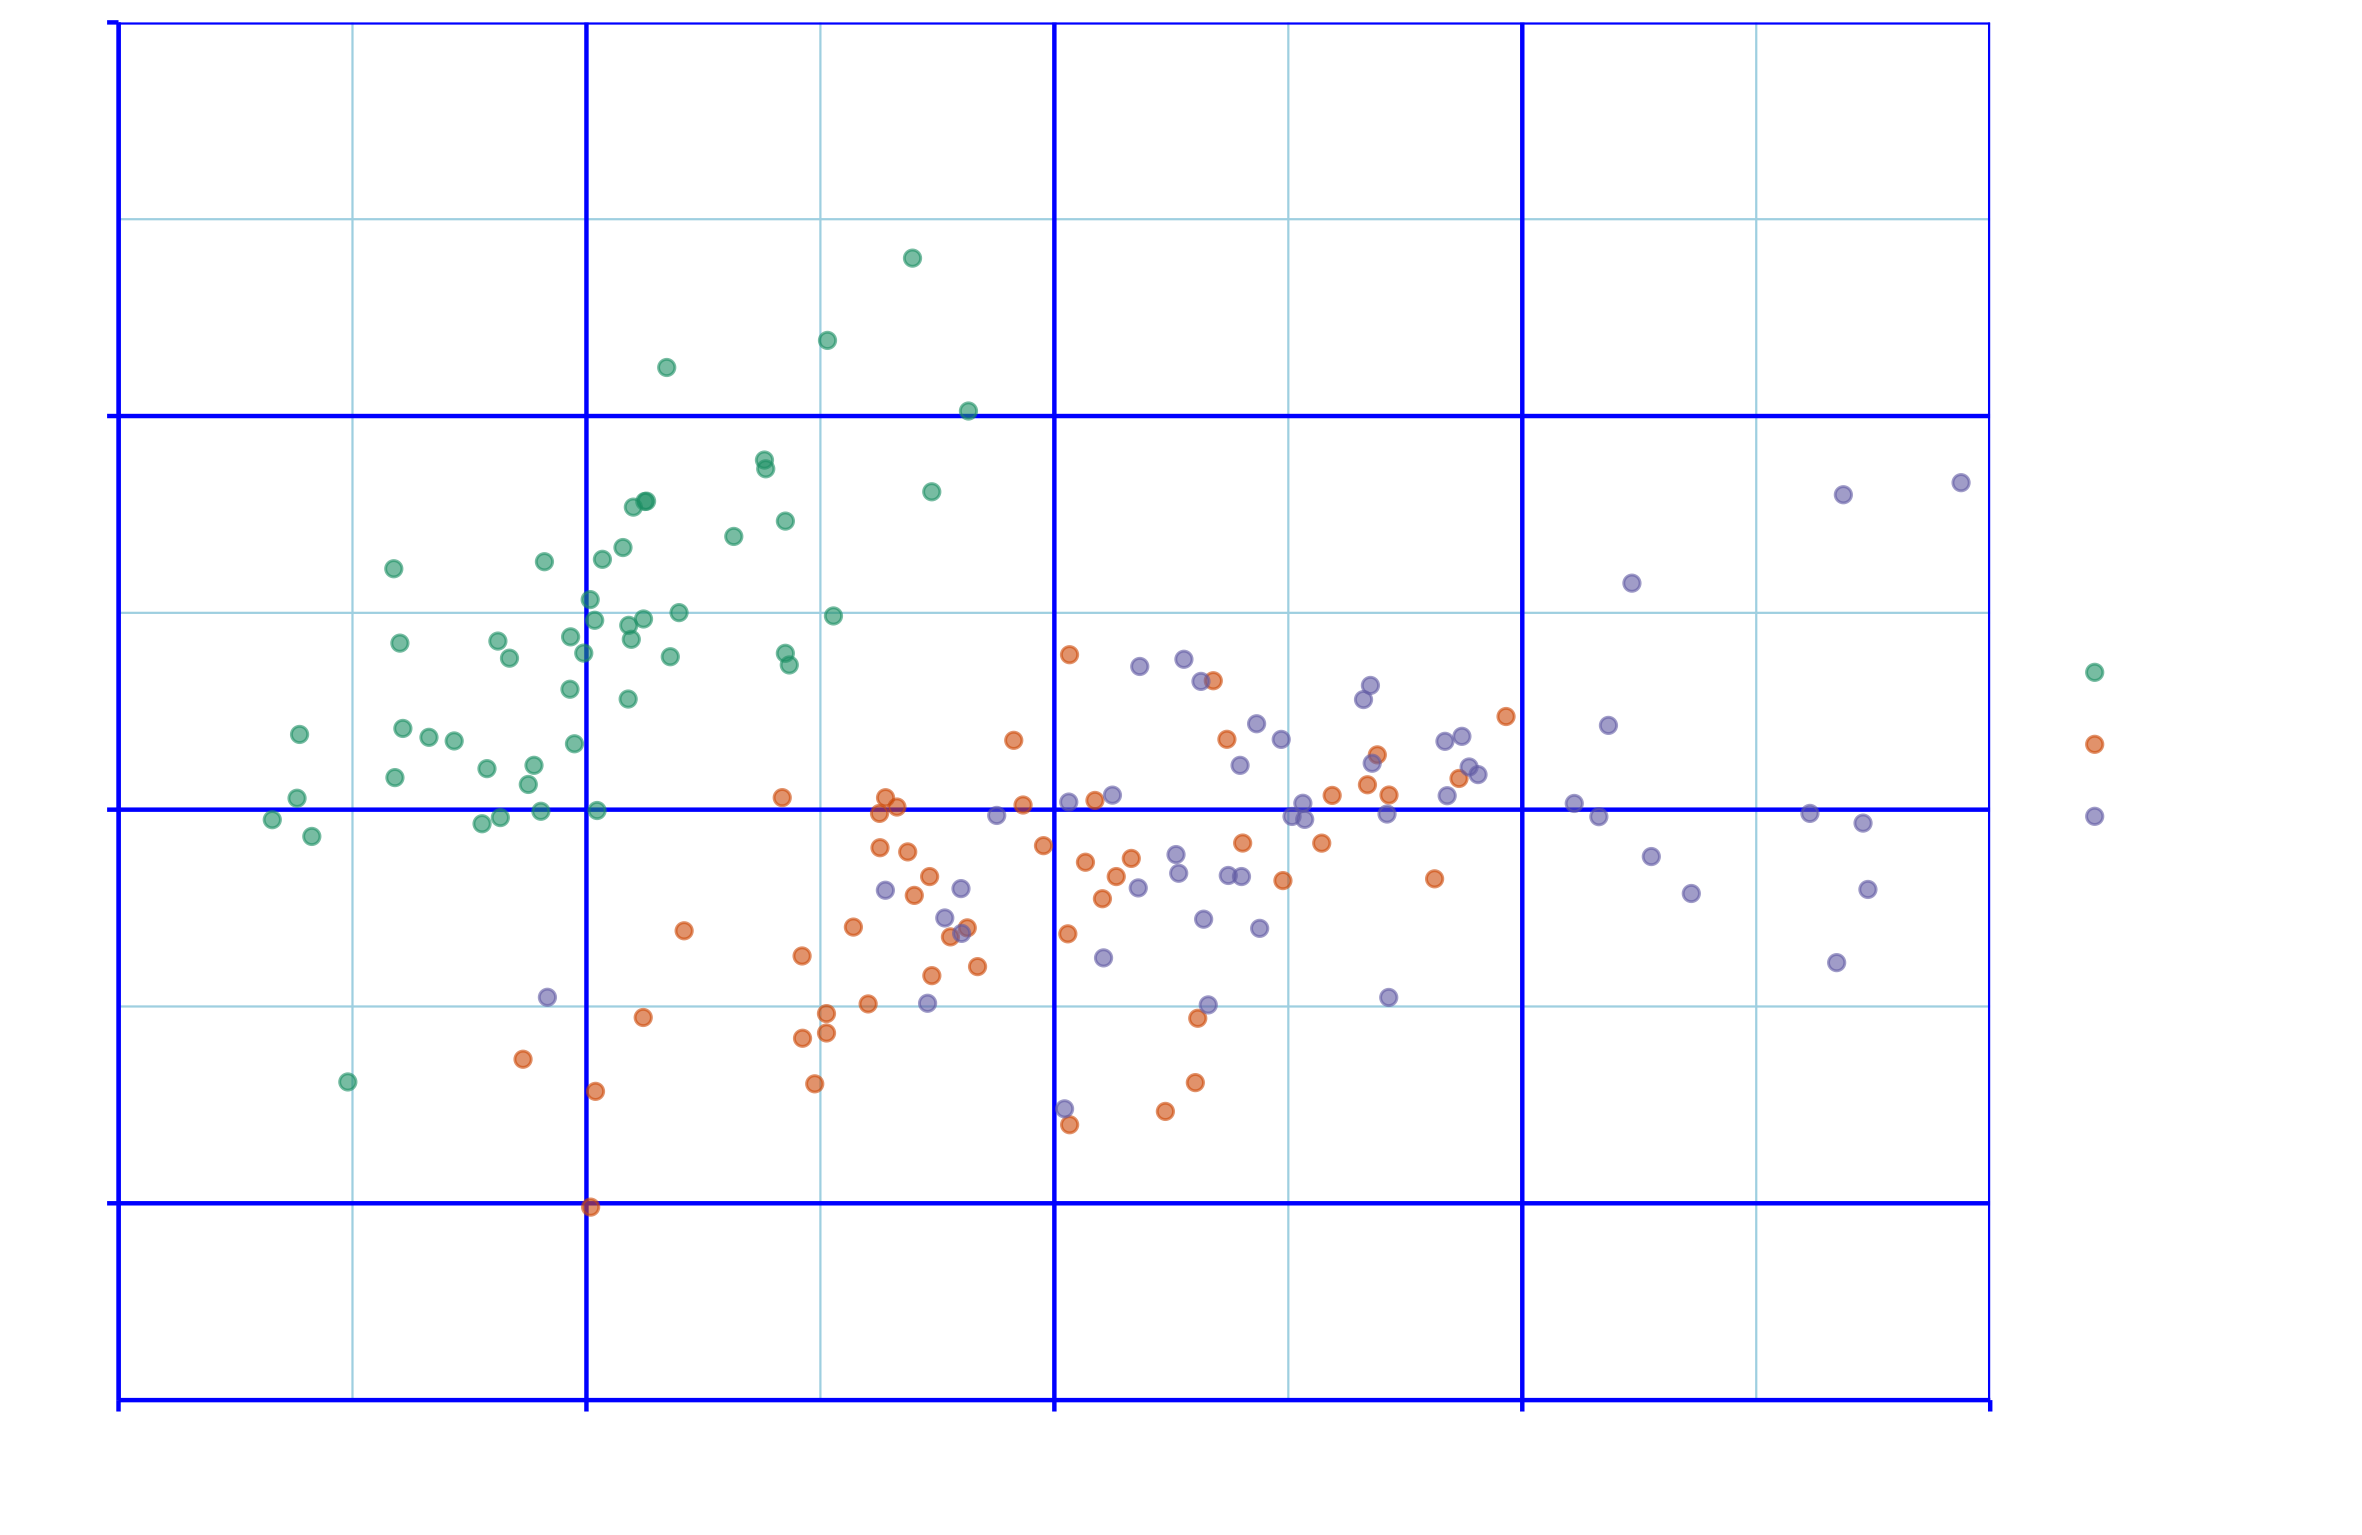
A starting plot...
ggplot(iris, aes(x = Sepal.Length, y = Sepal.Width, color = Species)) +
  geom_jitter(alpha = 0.6)
Rect elements
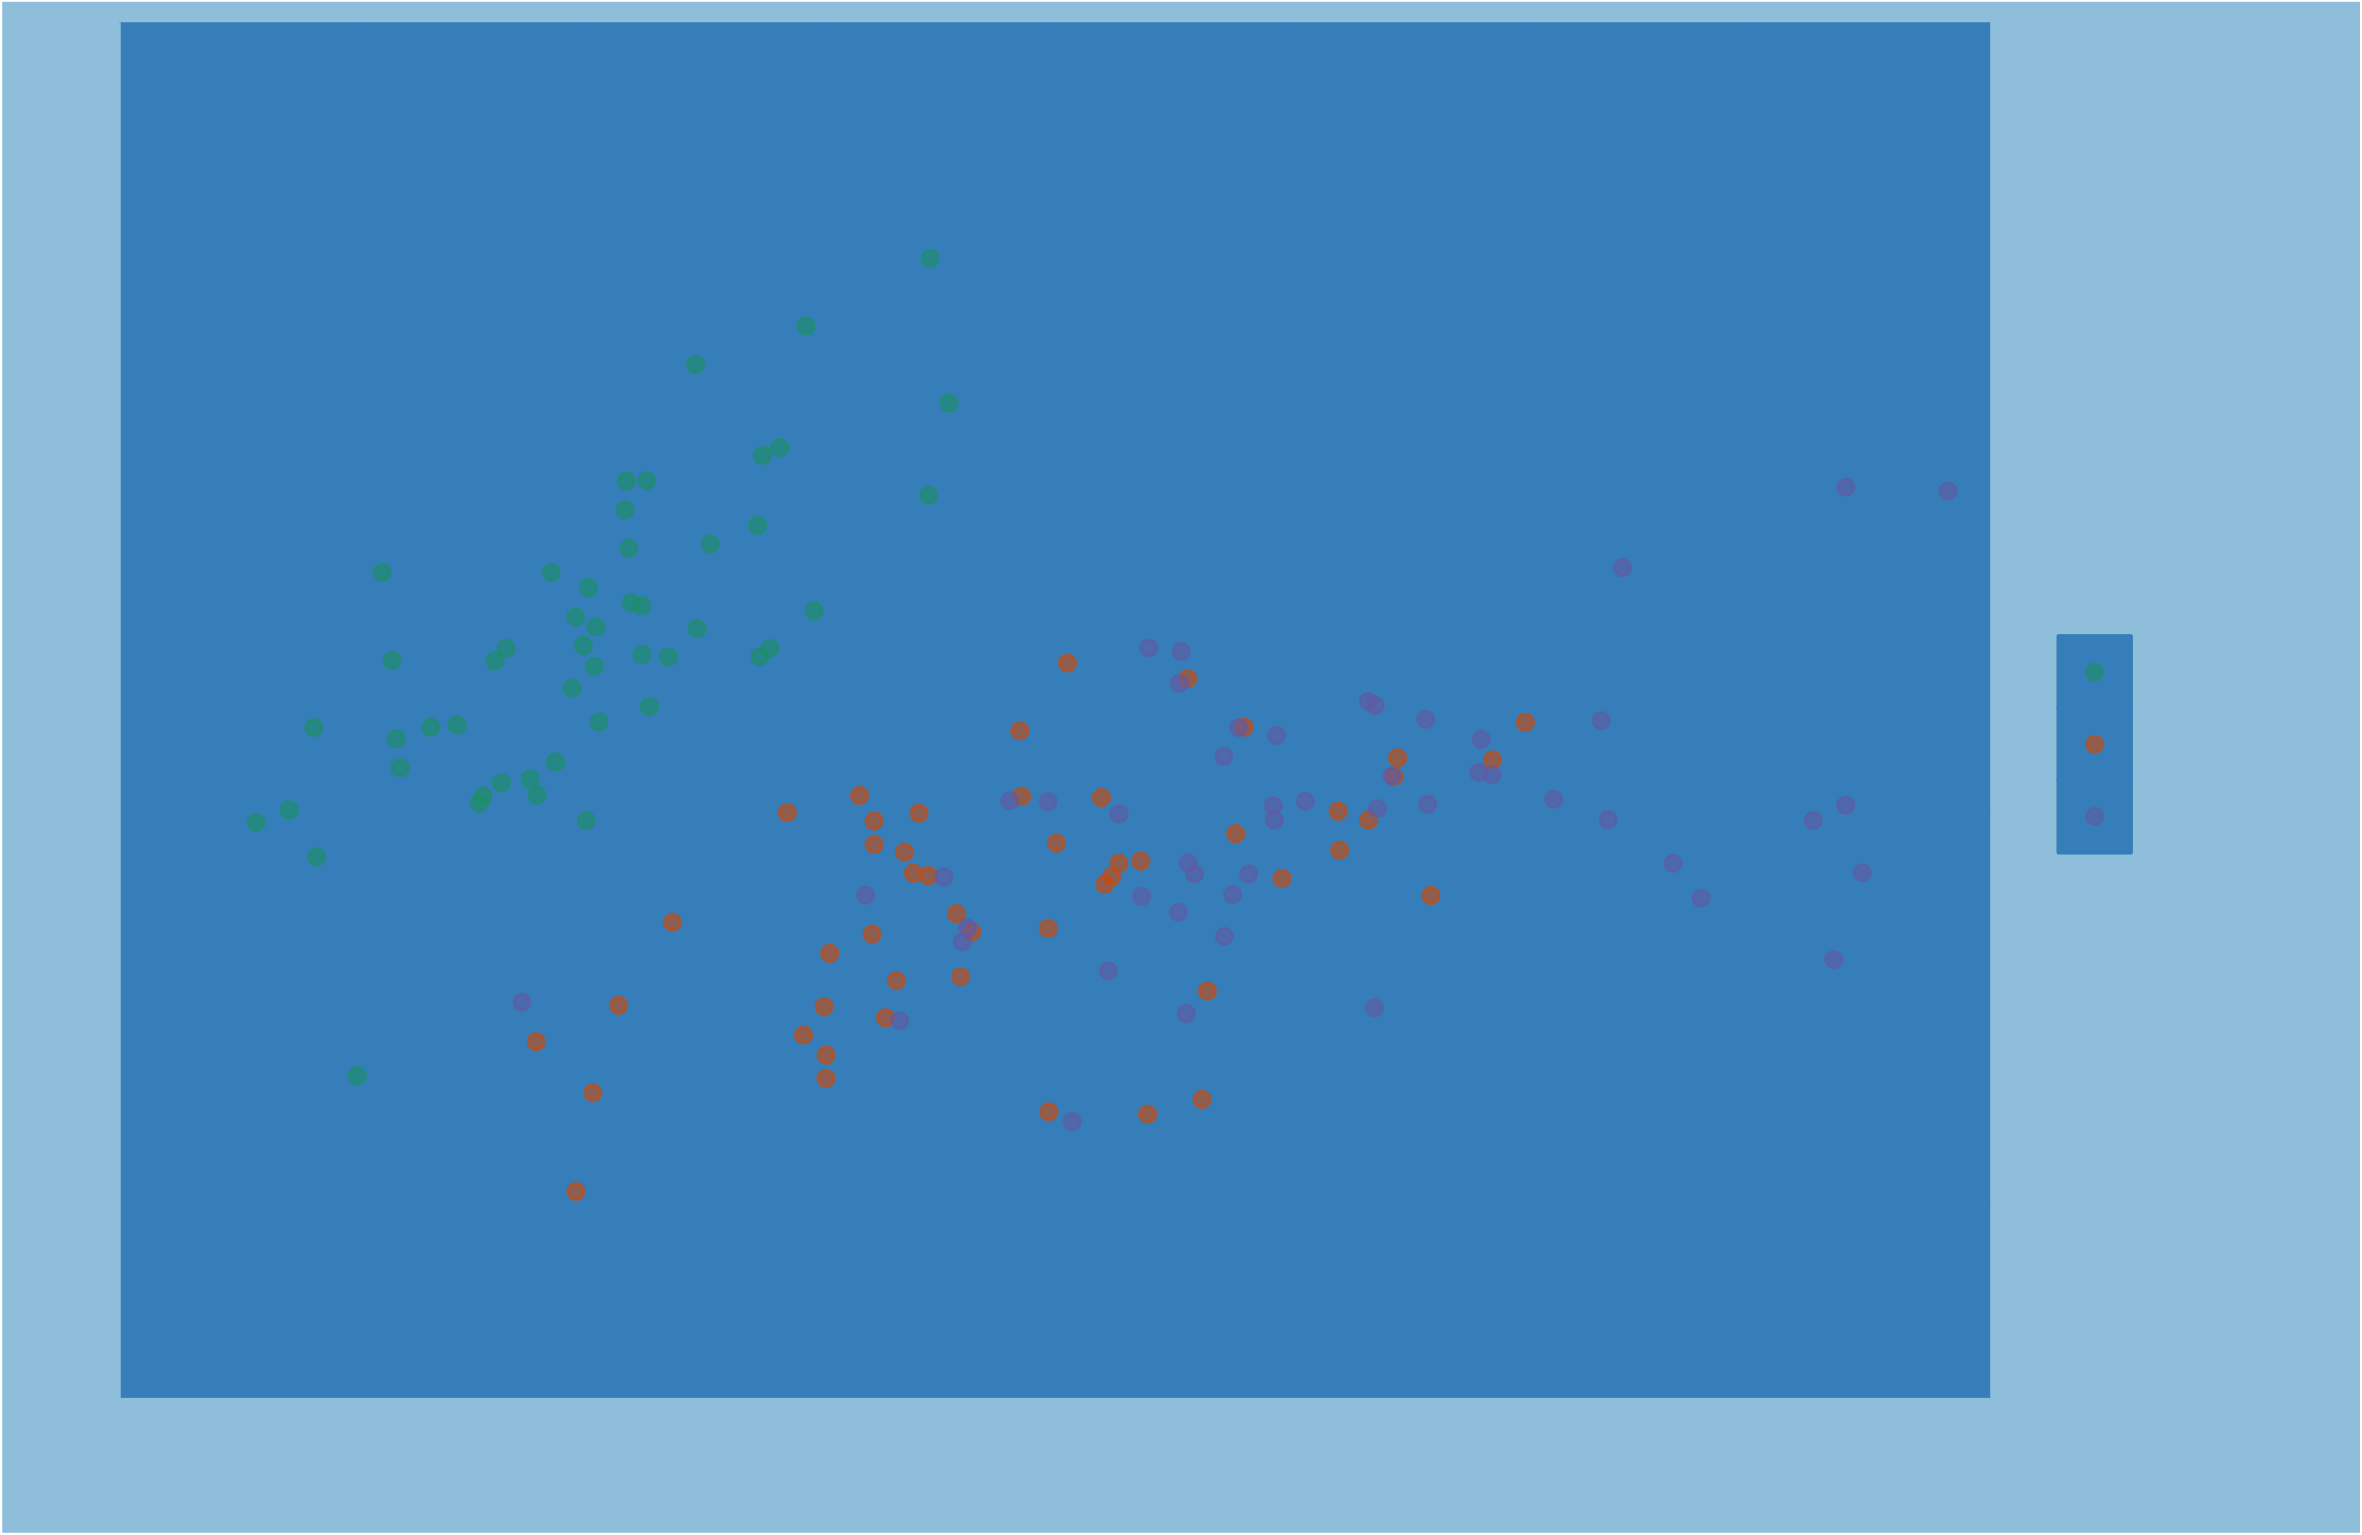
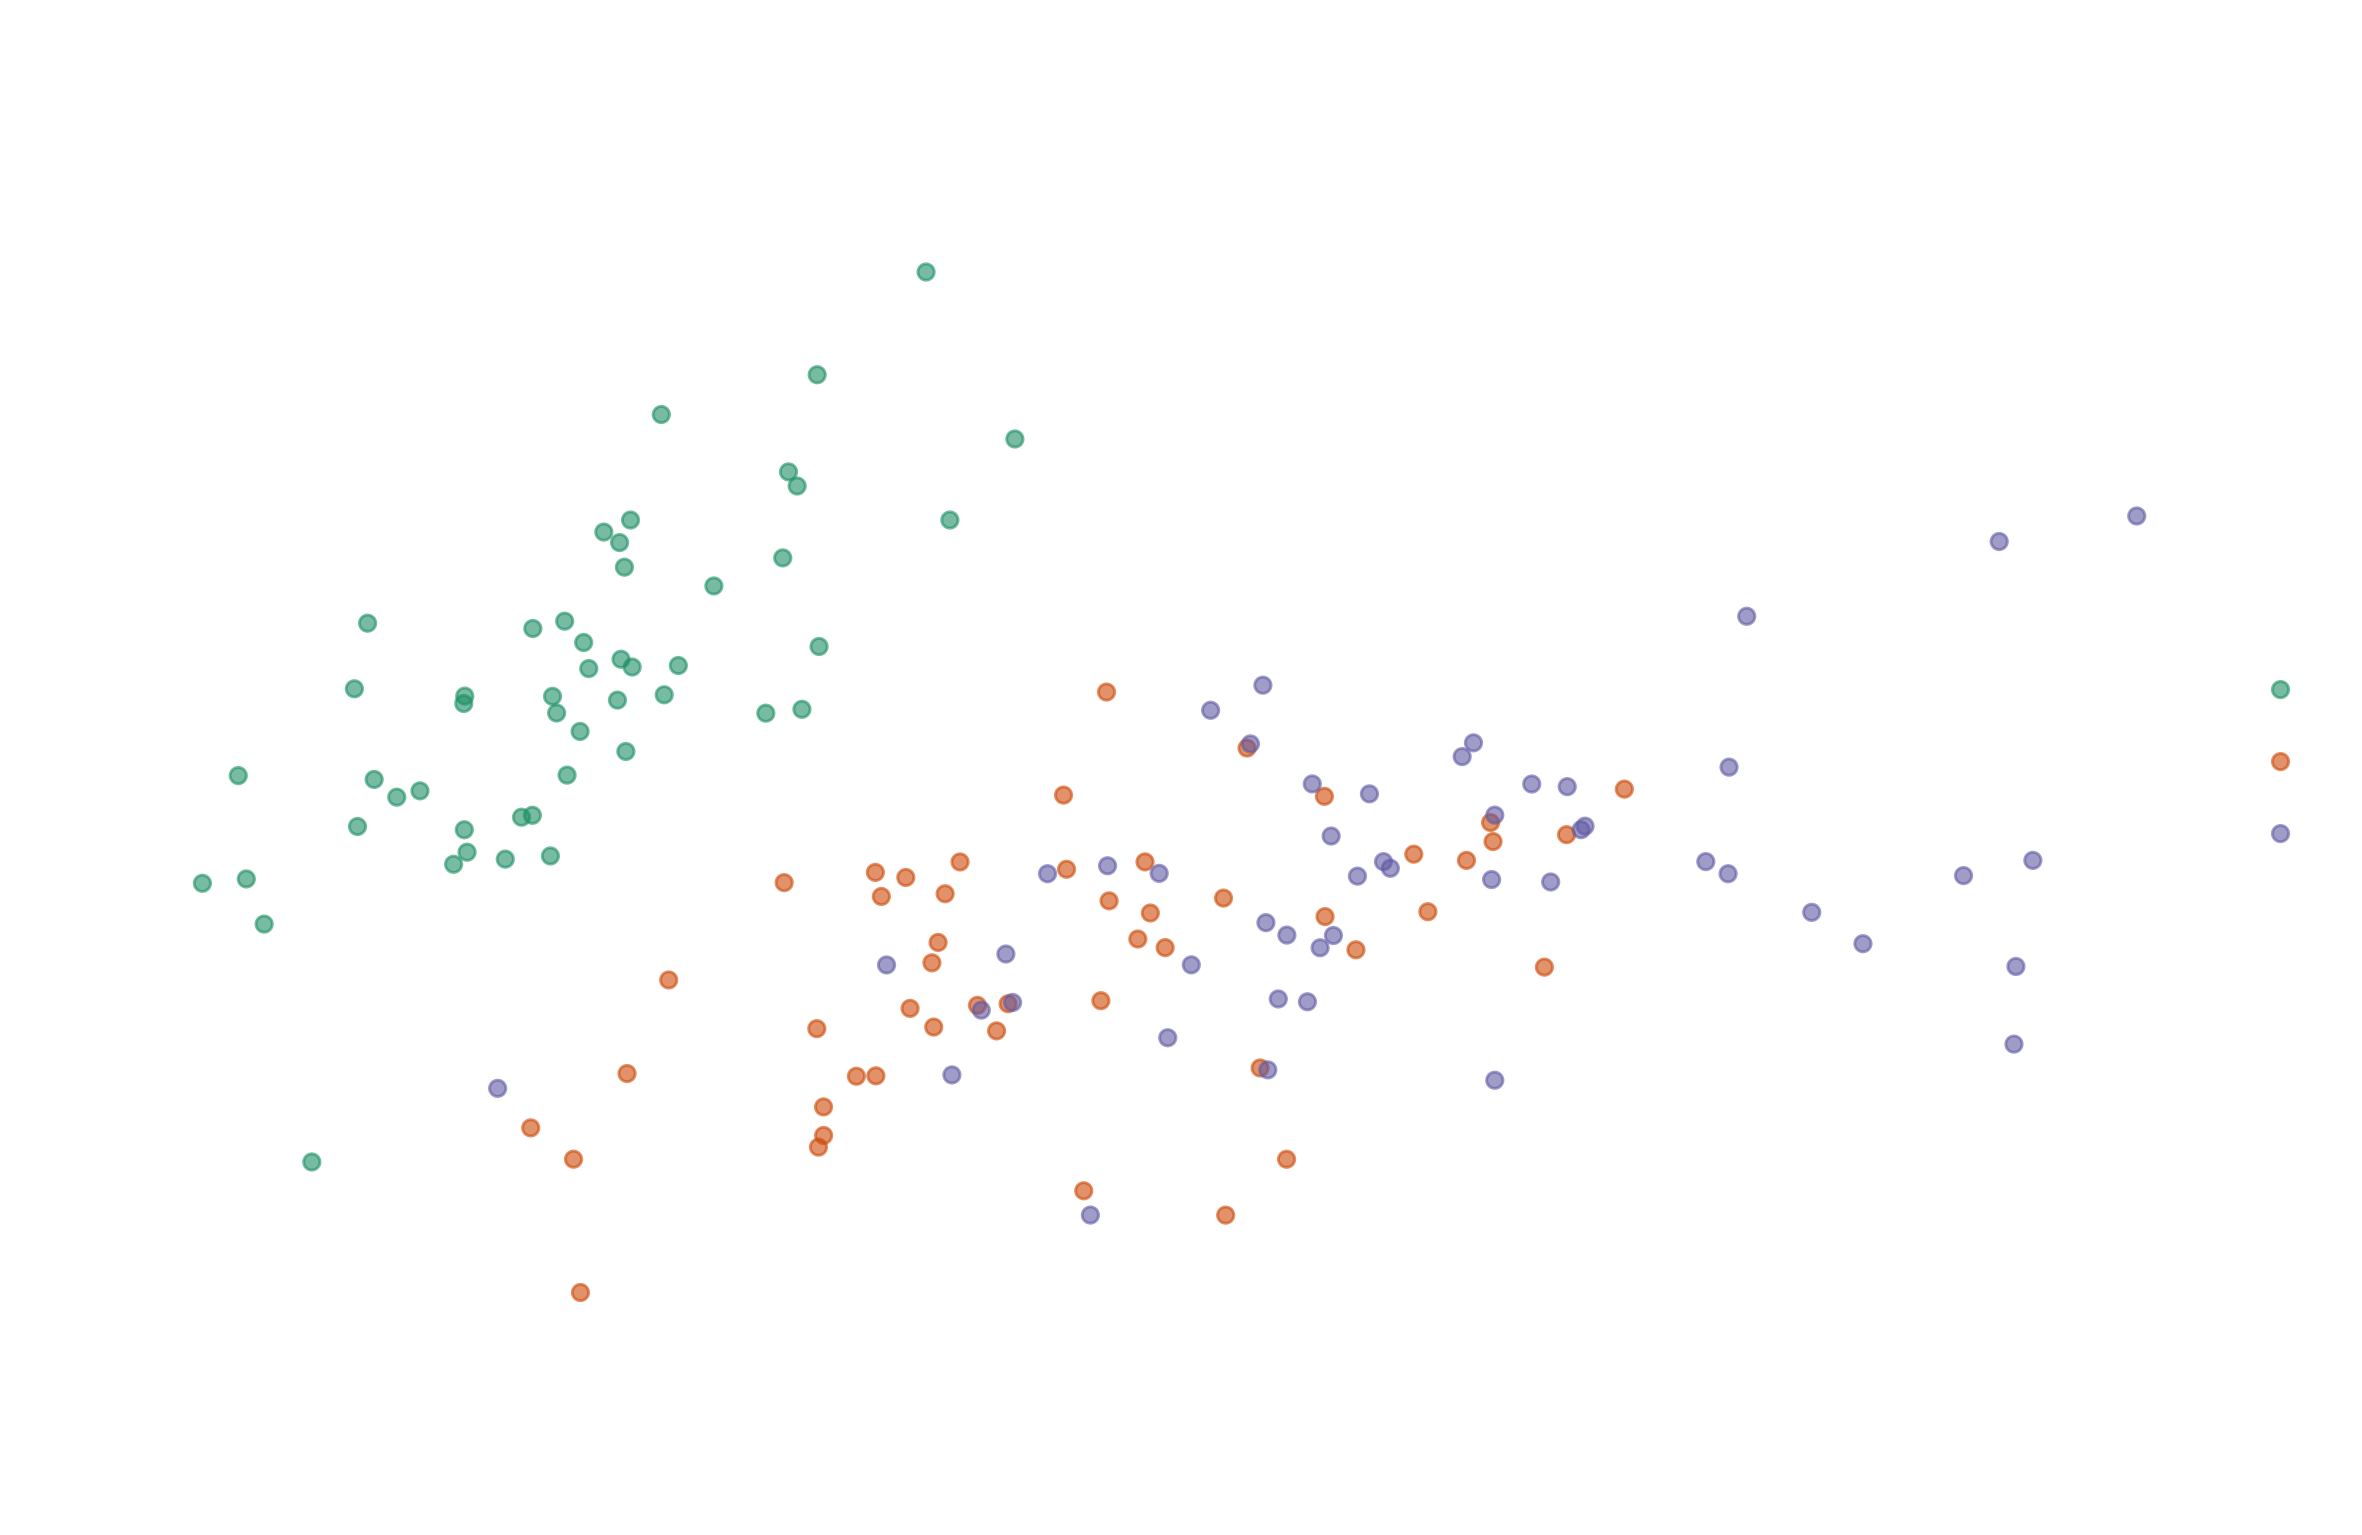
element_blank()
ggplot(iris, aes(x = Sepal.Length, y = Sepal.Width, color = Species)) +
  geom_jitter(alpha = 0.6) +
  theme(line = element_blank(),
        rect = element_blank(),
        text = element_blank())