Facet labels and order
Intermediate Data Visualization with ggplot2

Rick Scavetta
Founder, Scavetta Academy
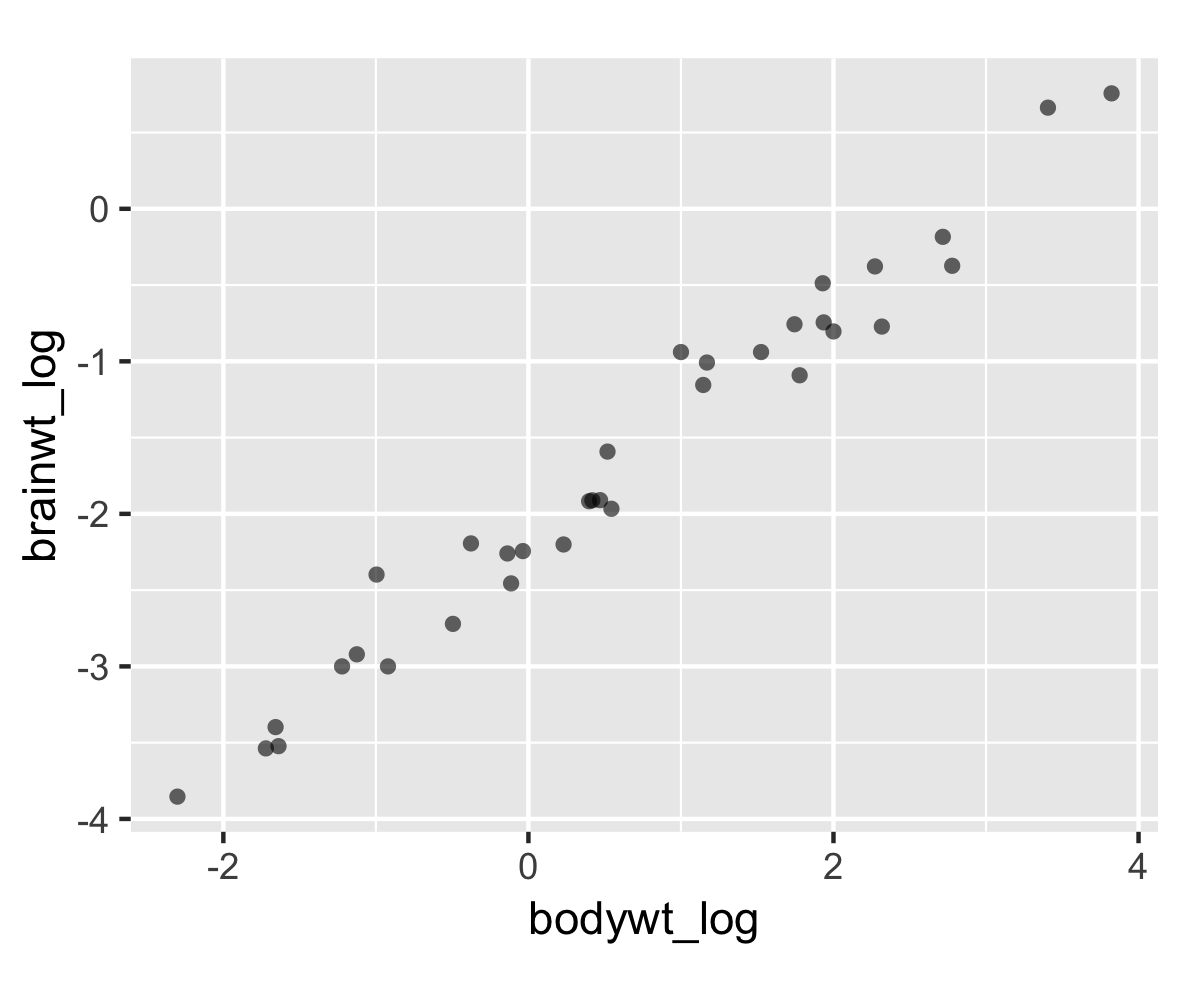
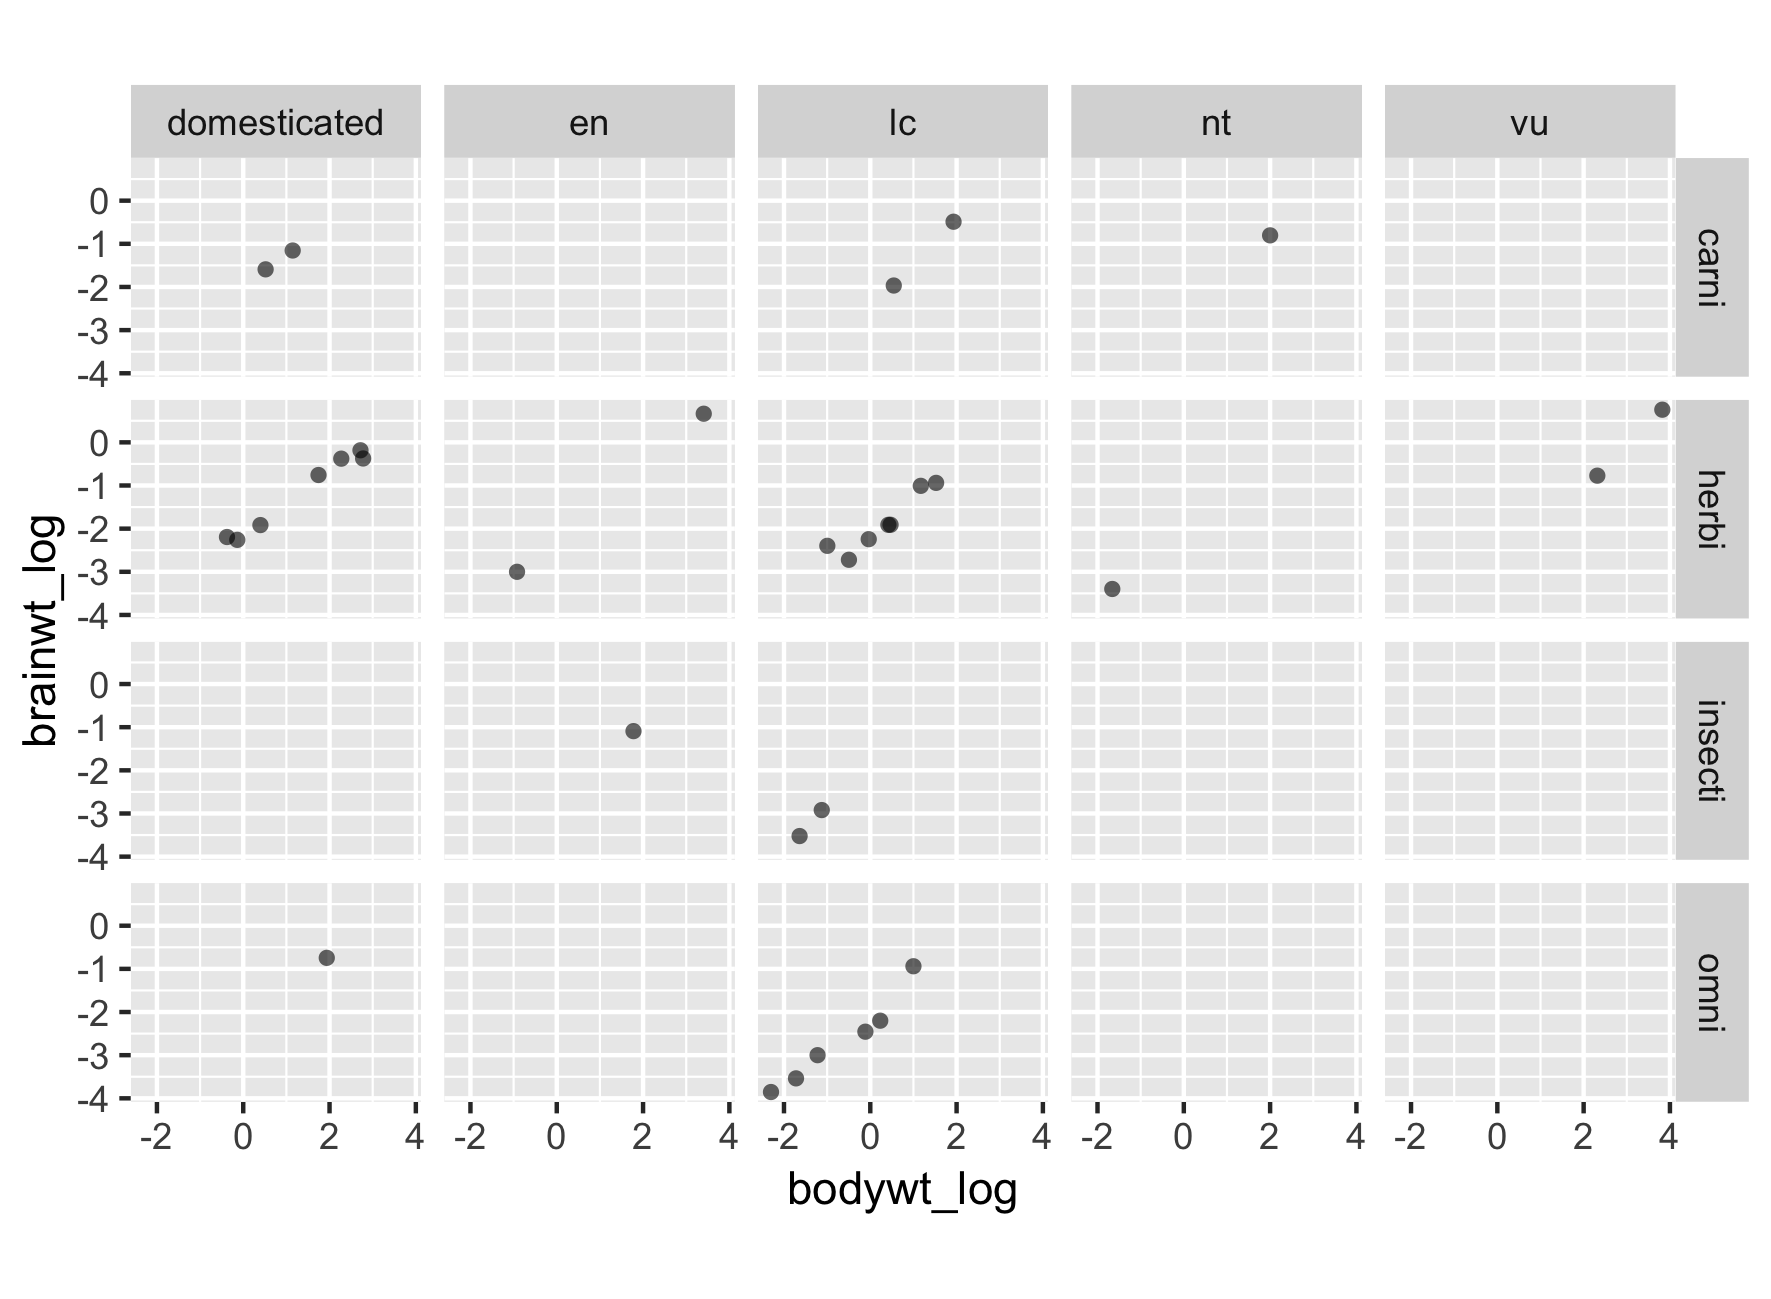
A new dataframe
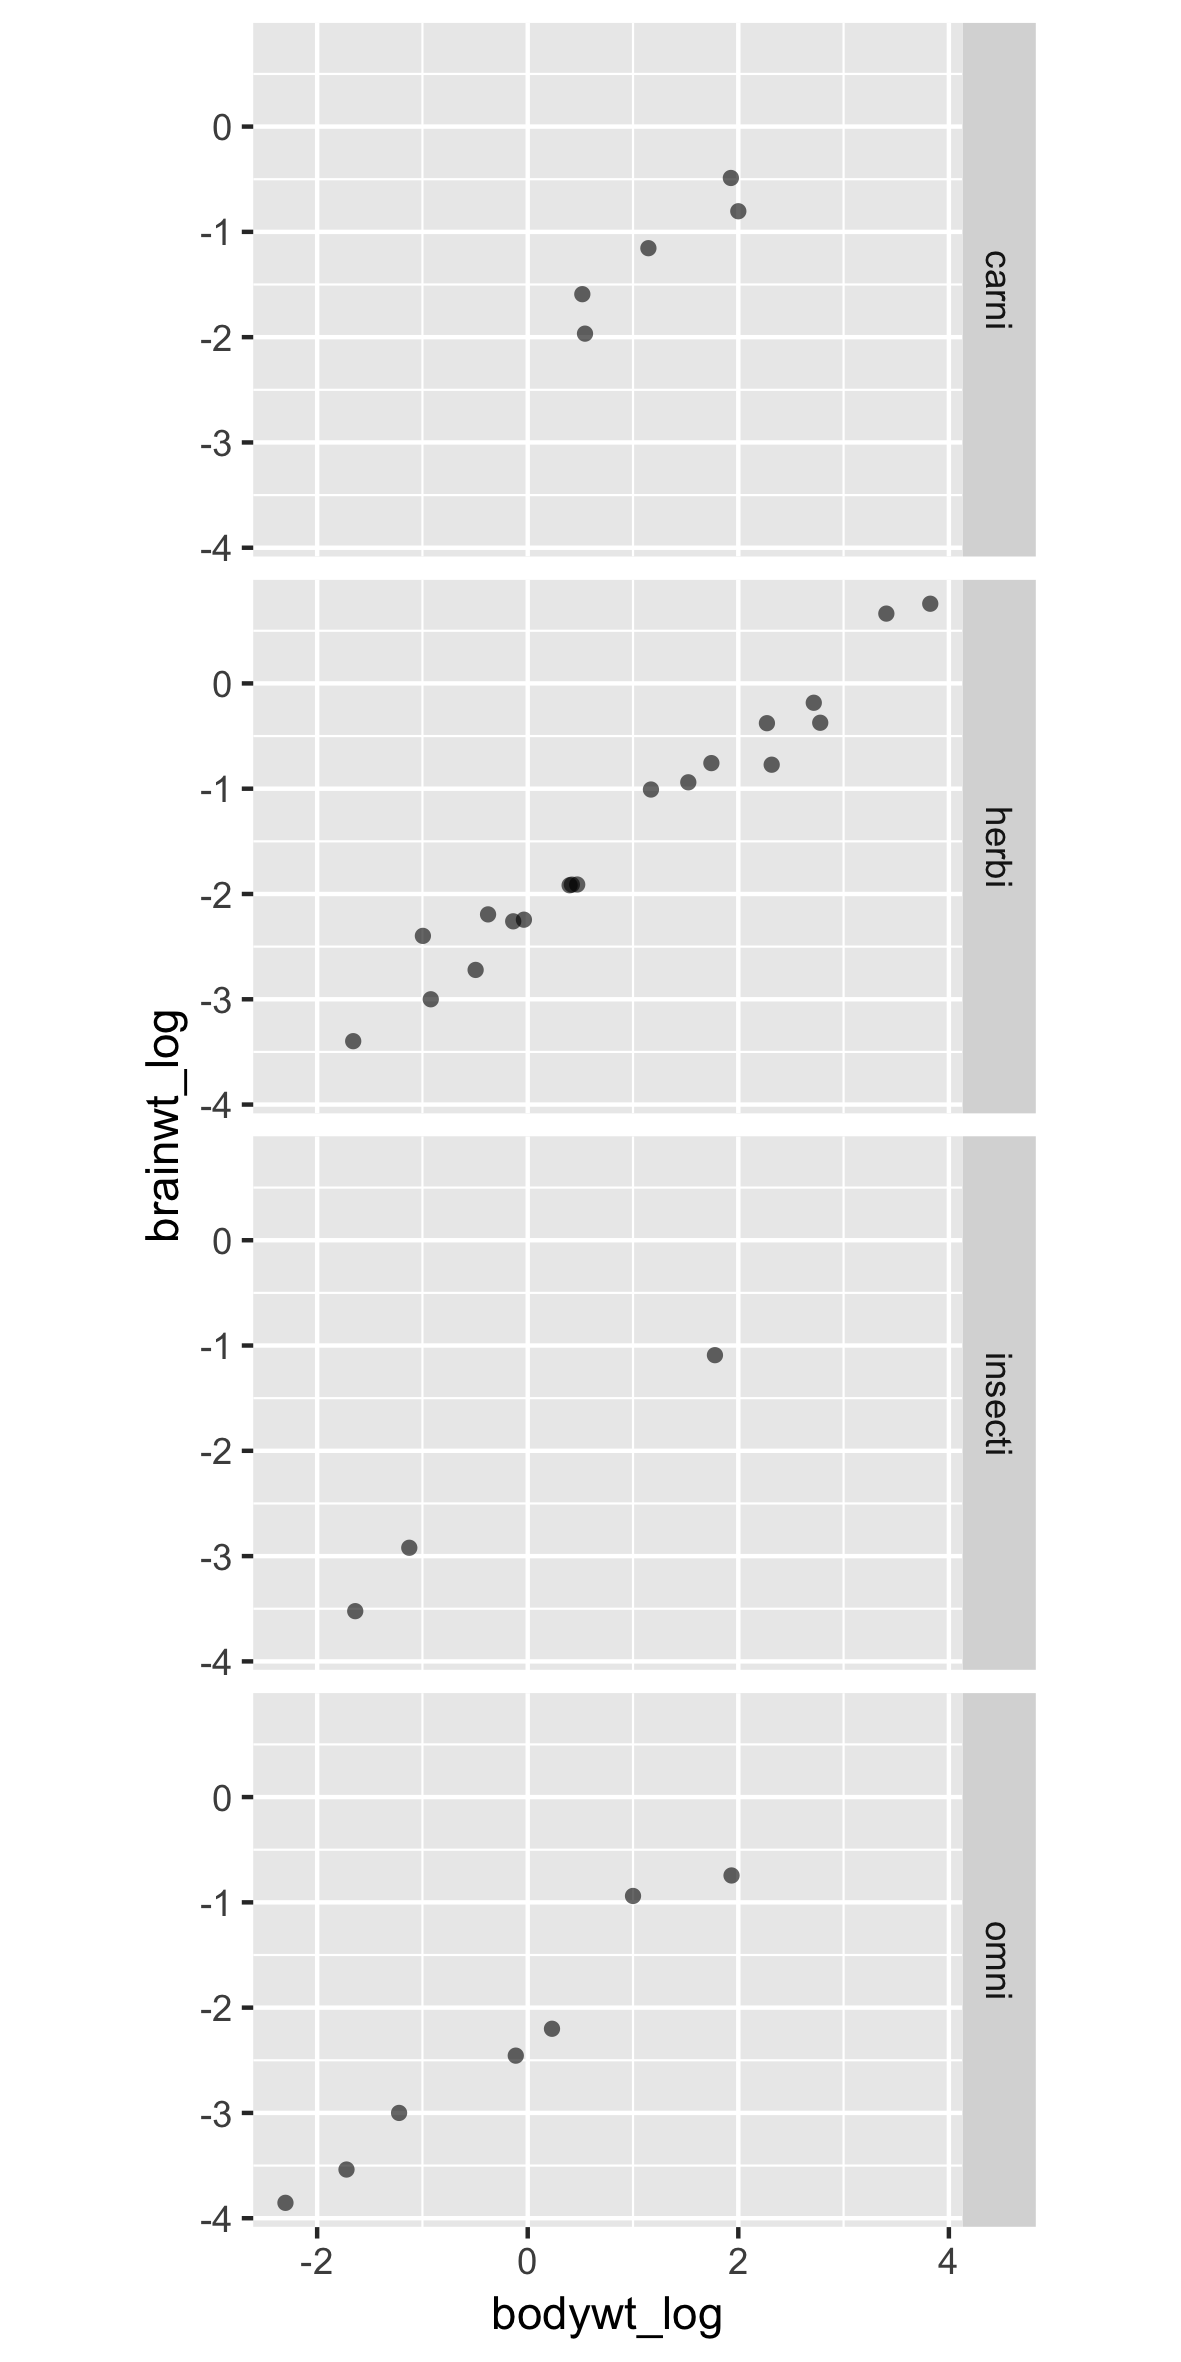
A new dataframe, with facets

A new dataframe, with facets
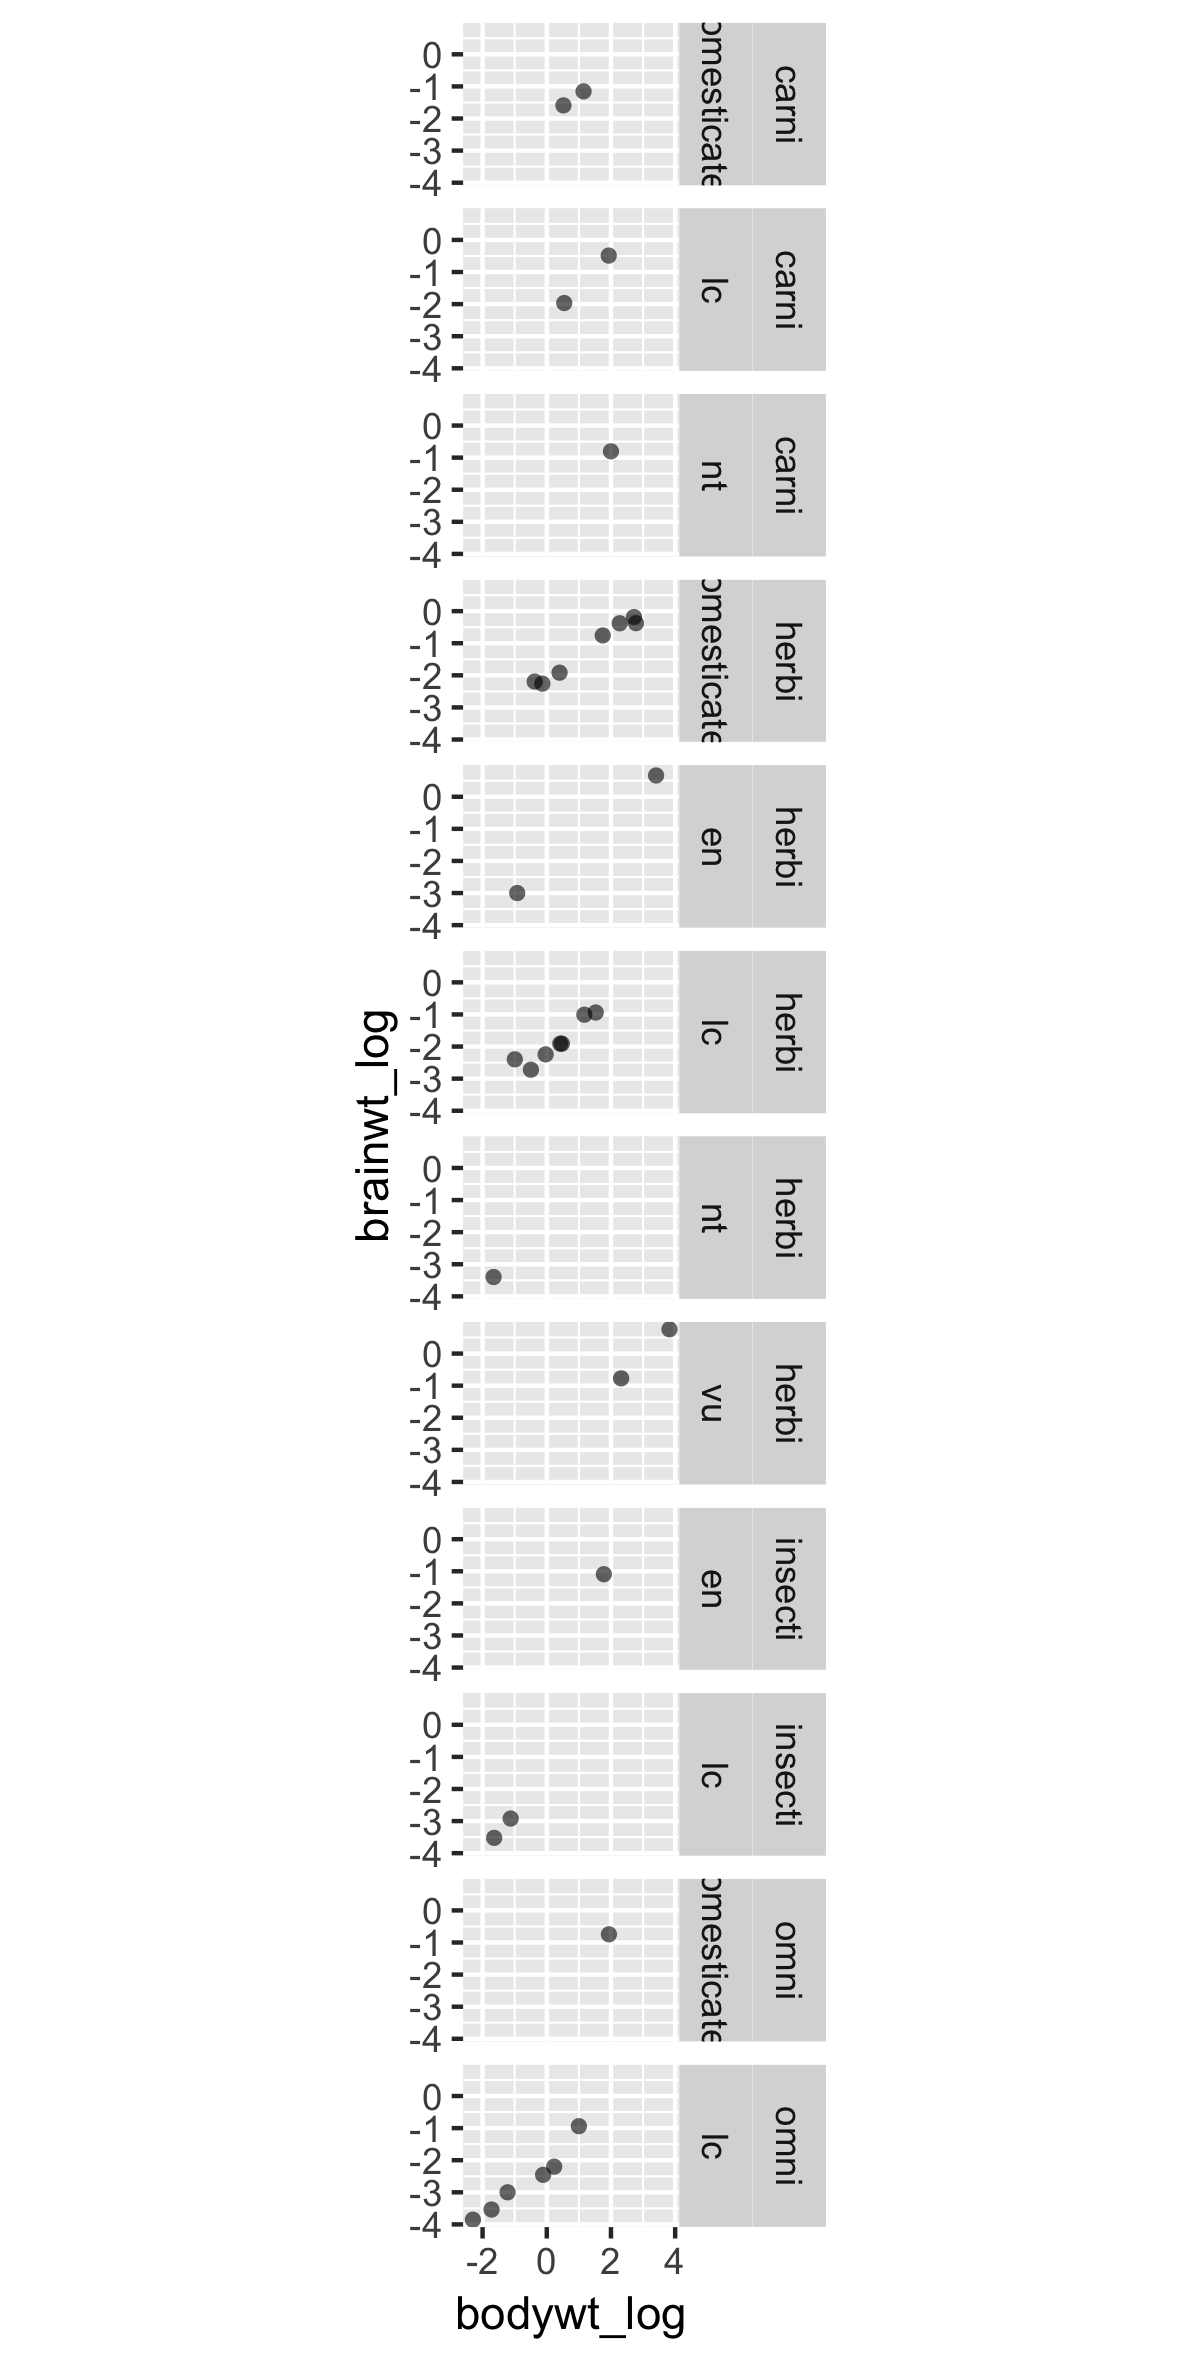
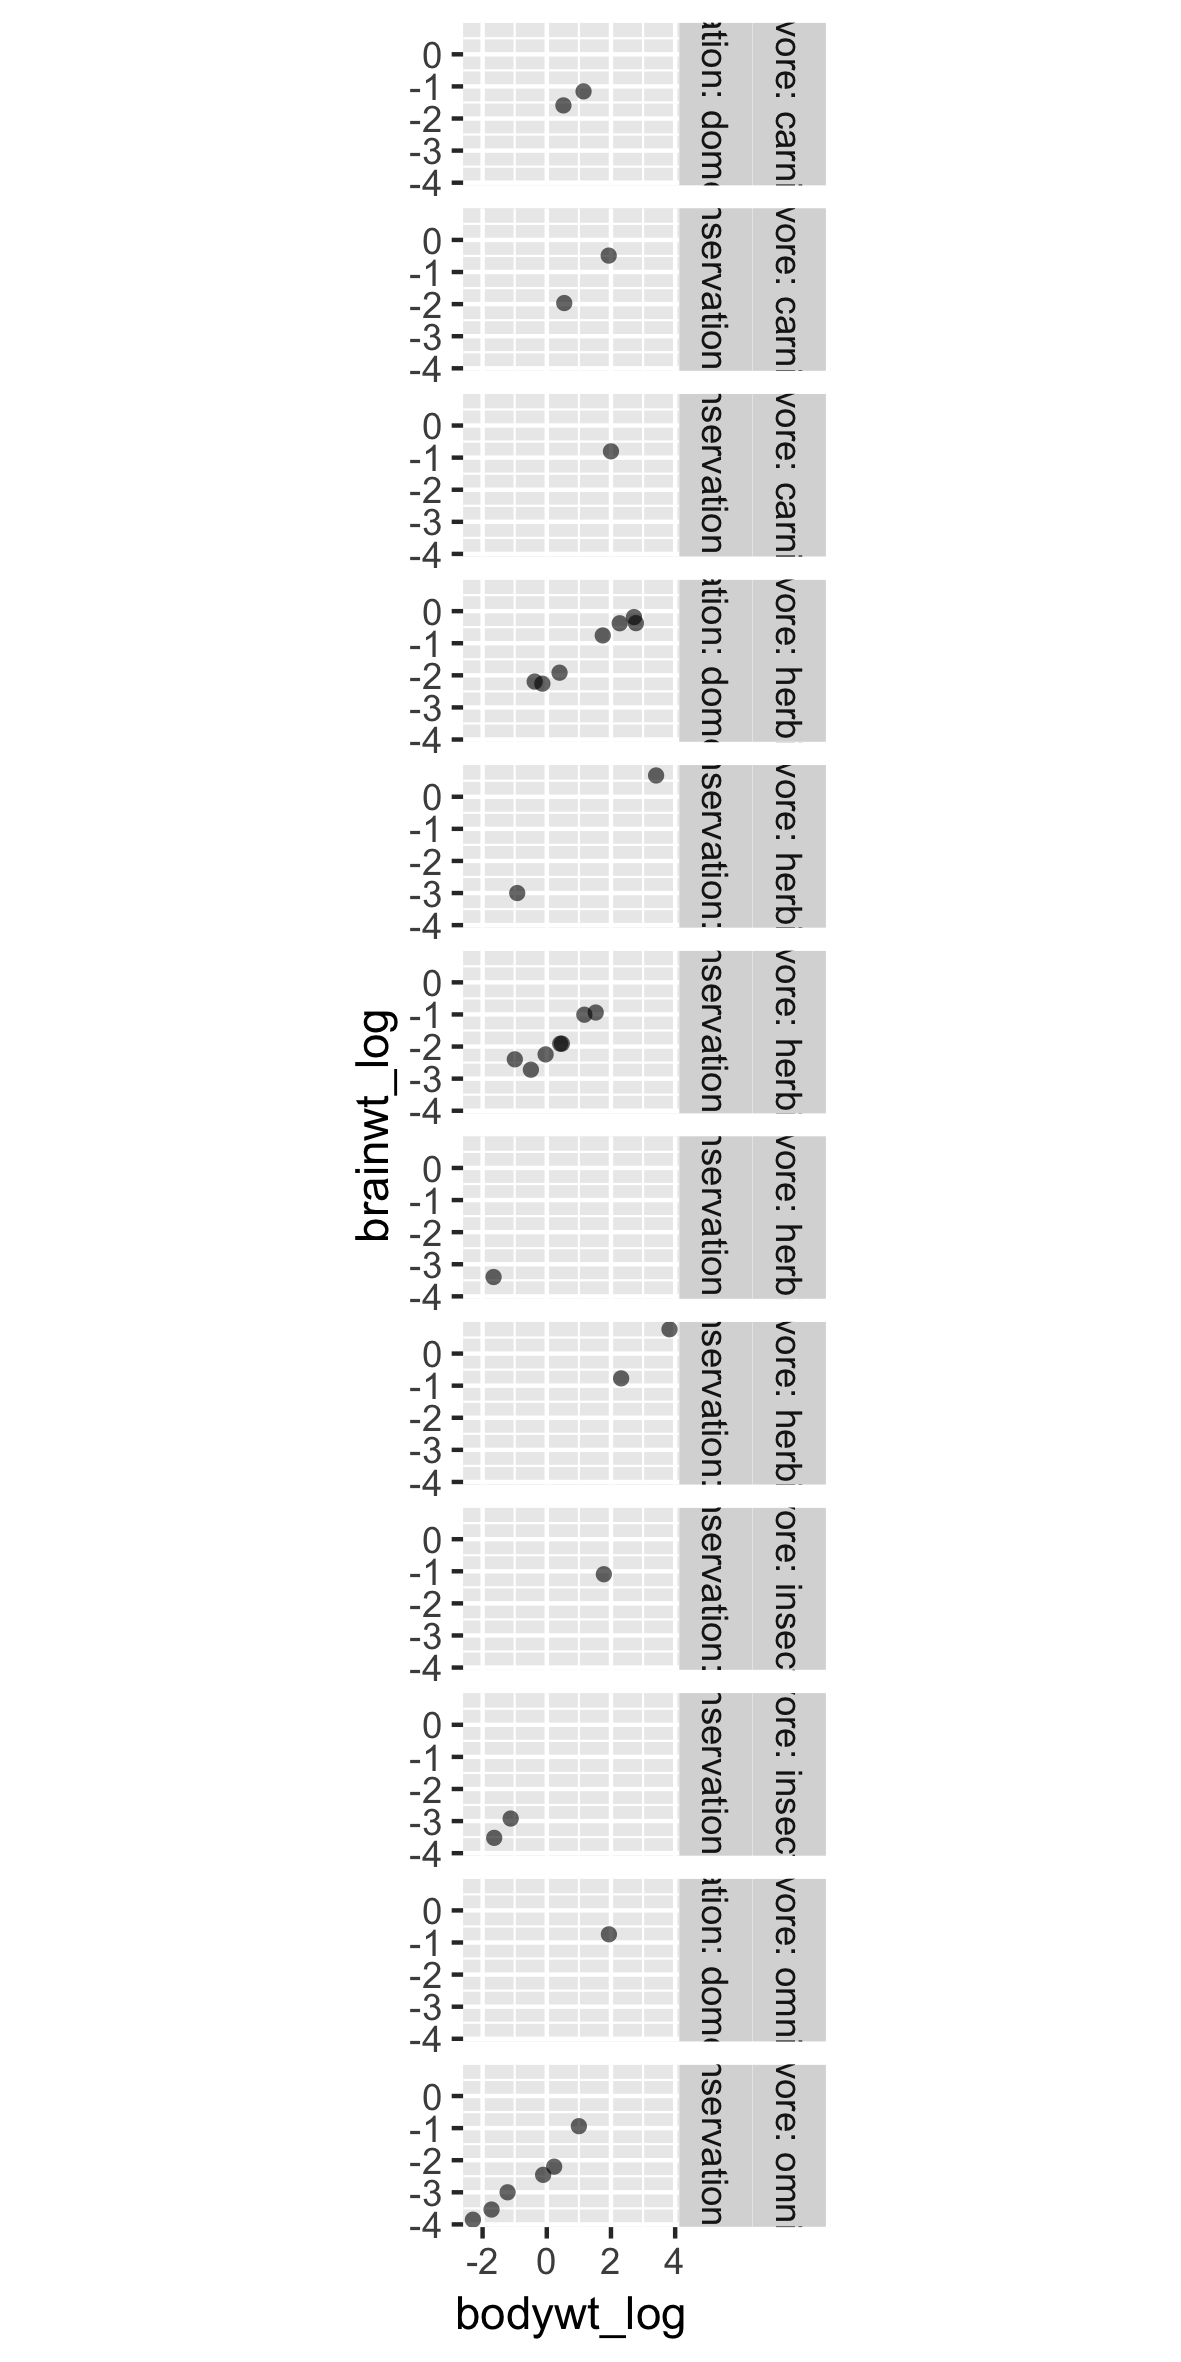
Poor labels and order
Poor labels and order
The labeller argument
Using label_both adds the variable name

Two variables on one side
Using label_context avoids ambiguity
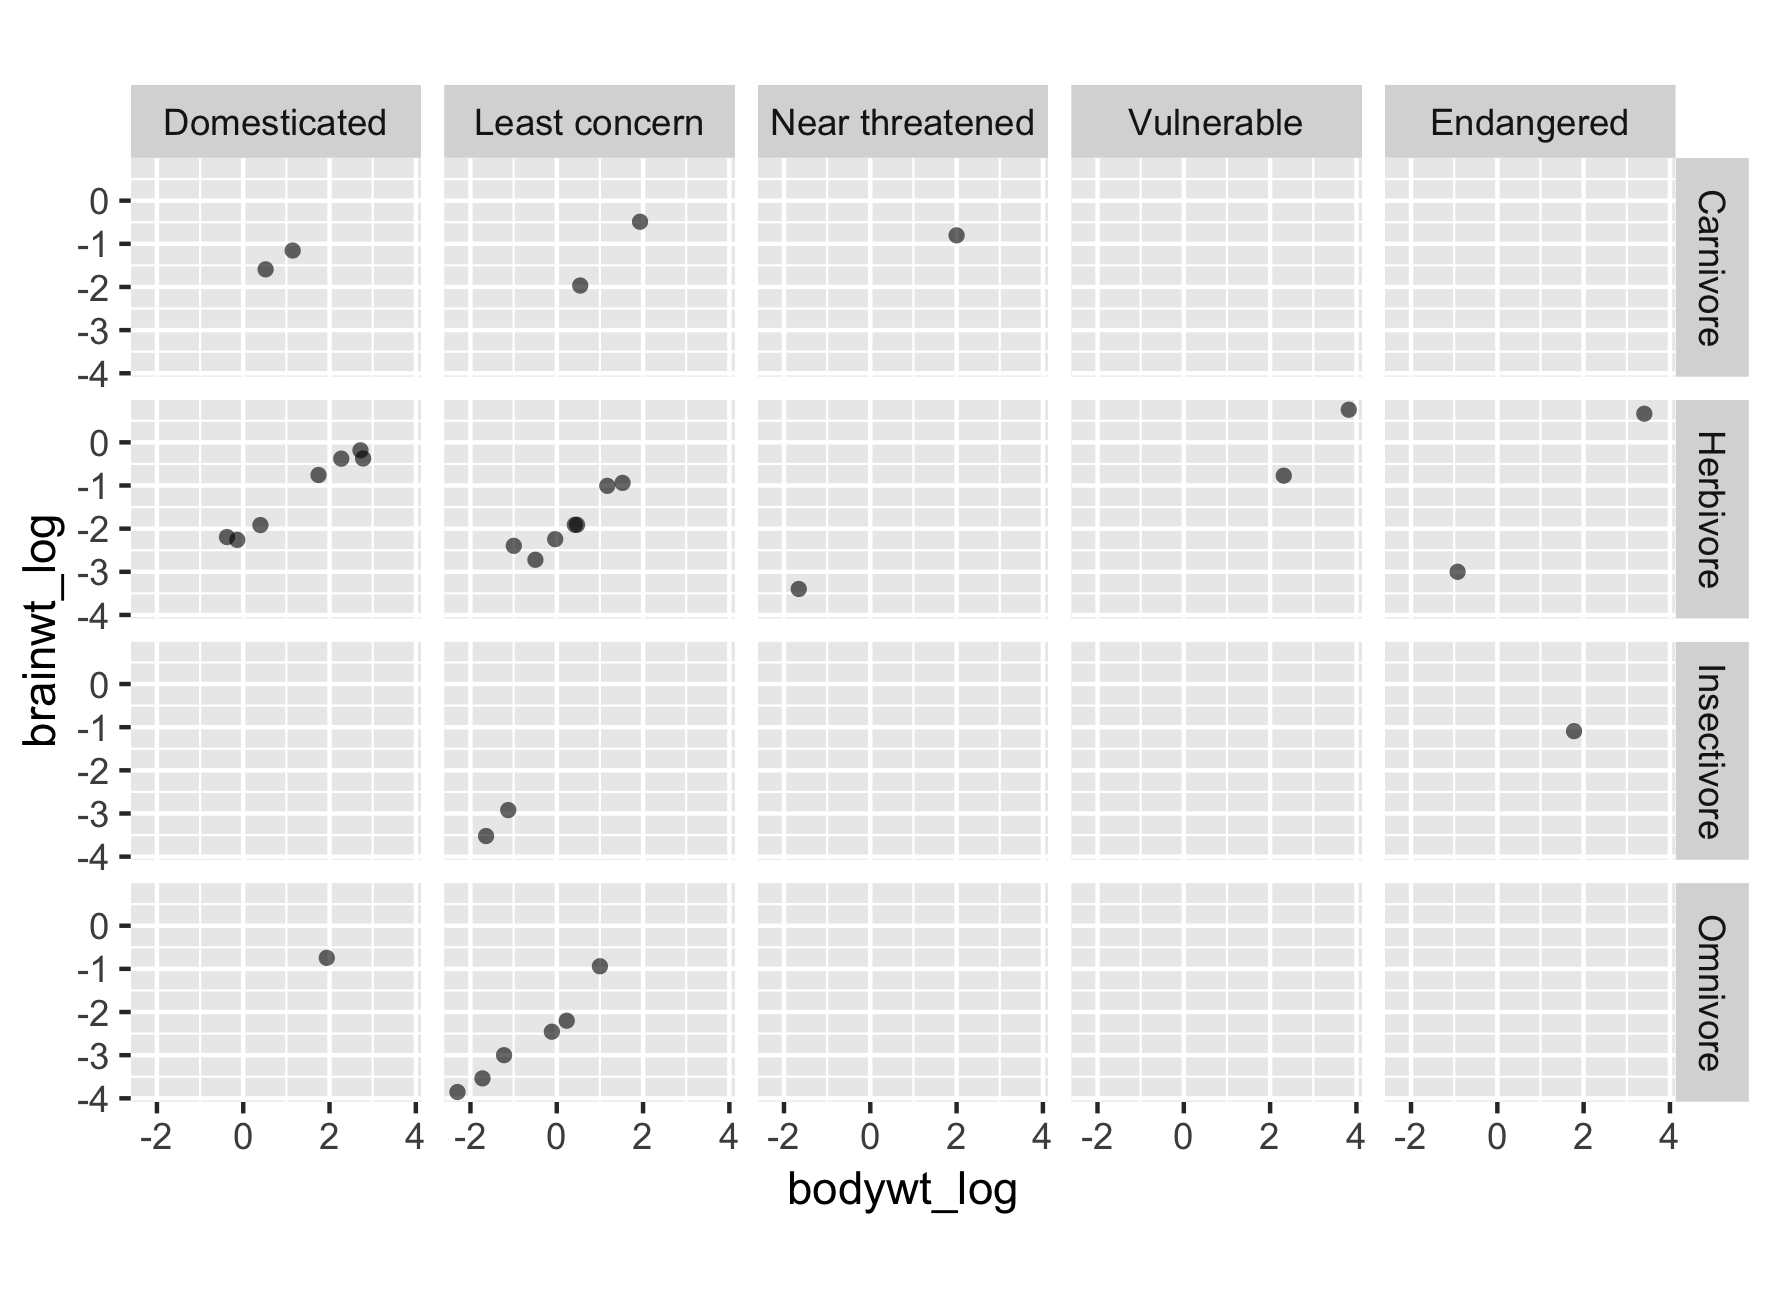
Use rows and columns when appropriate
Use rows and columns when appropriate
Use rows and columns when appropriate
Reinitialize plot with new labels
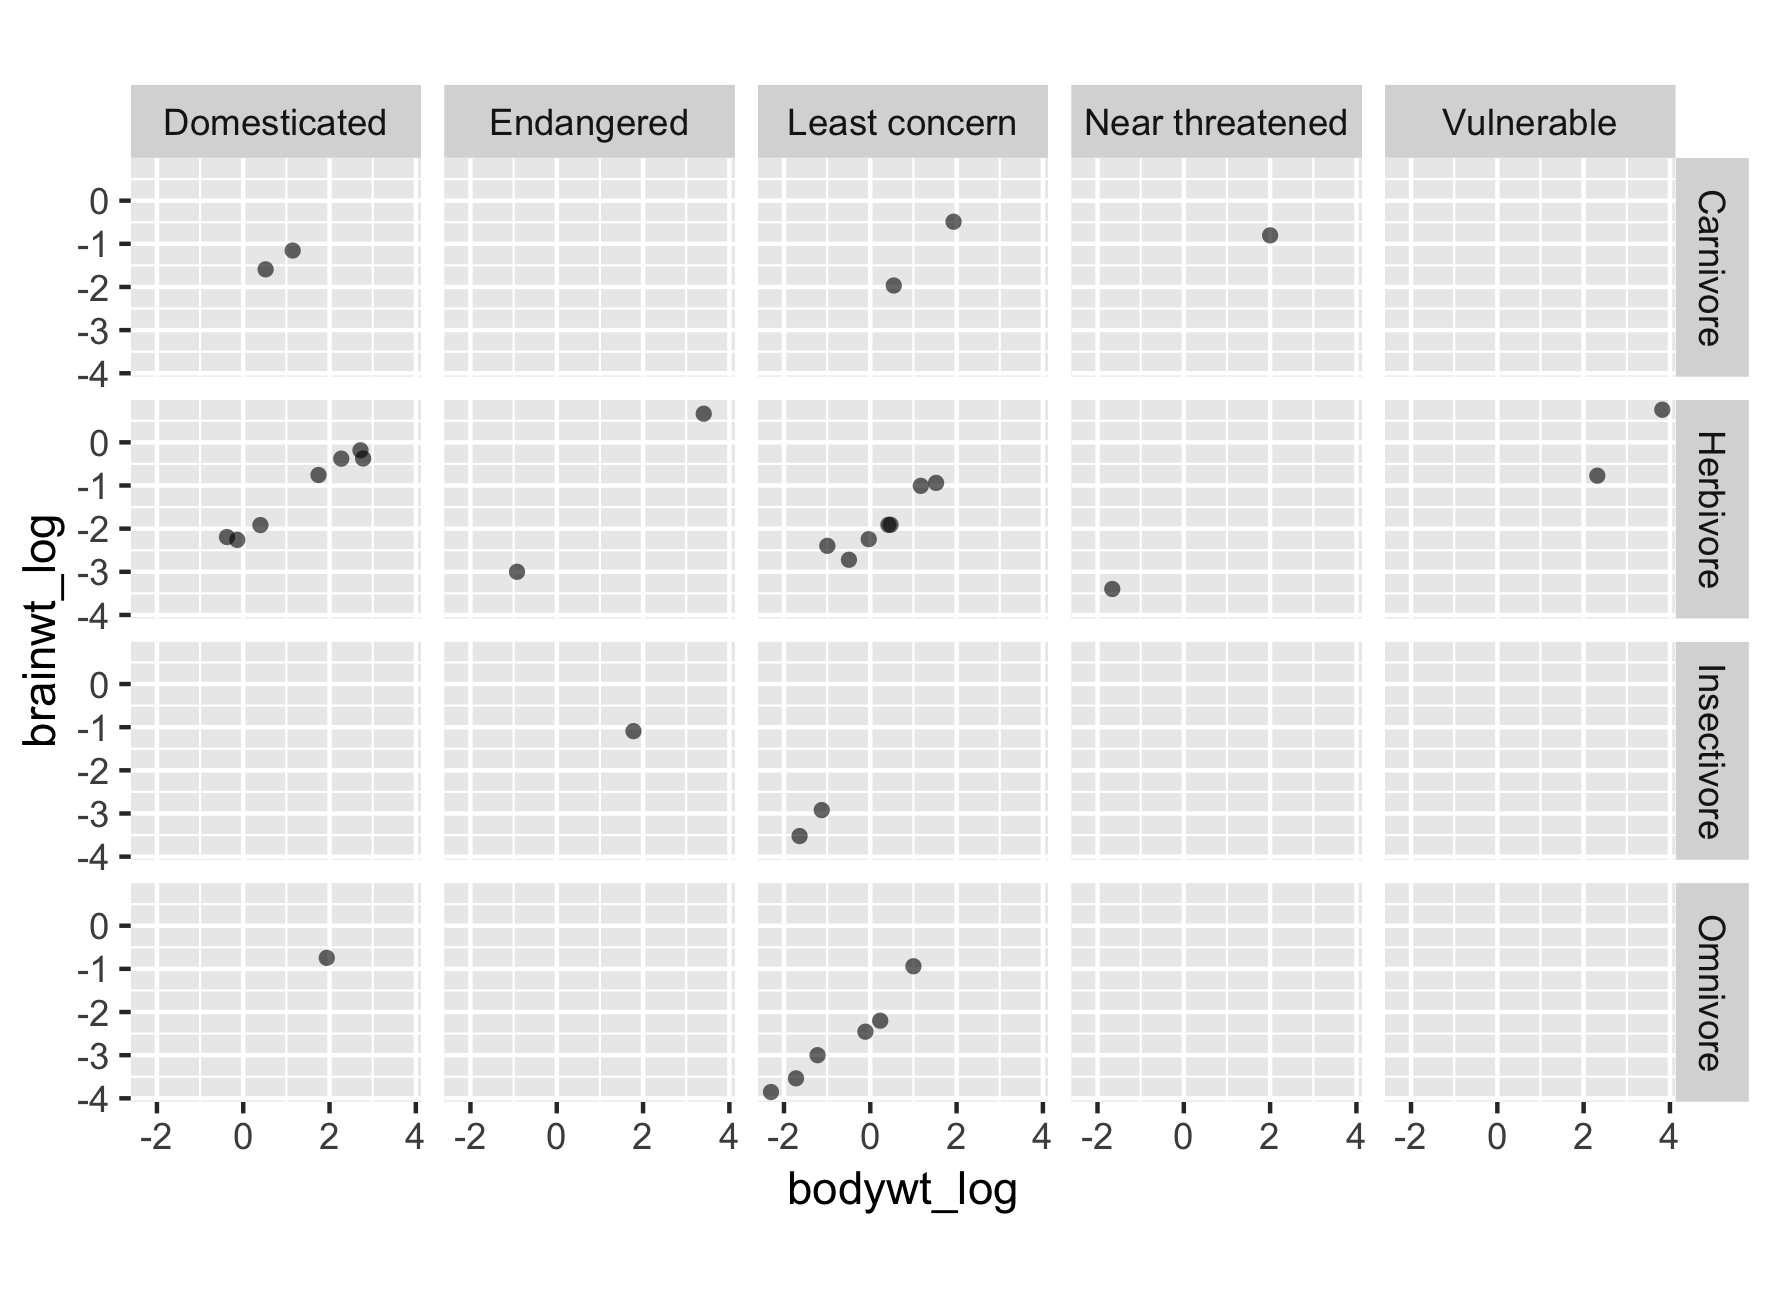
Reinitialize plot with new labels
Reinitialize plot with new order