The Coordinates Layer
Intermediate Data Visualization with ggplot2

Rick Scavetta
Founder, Scavetta Academy
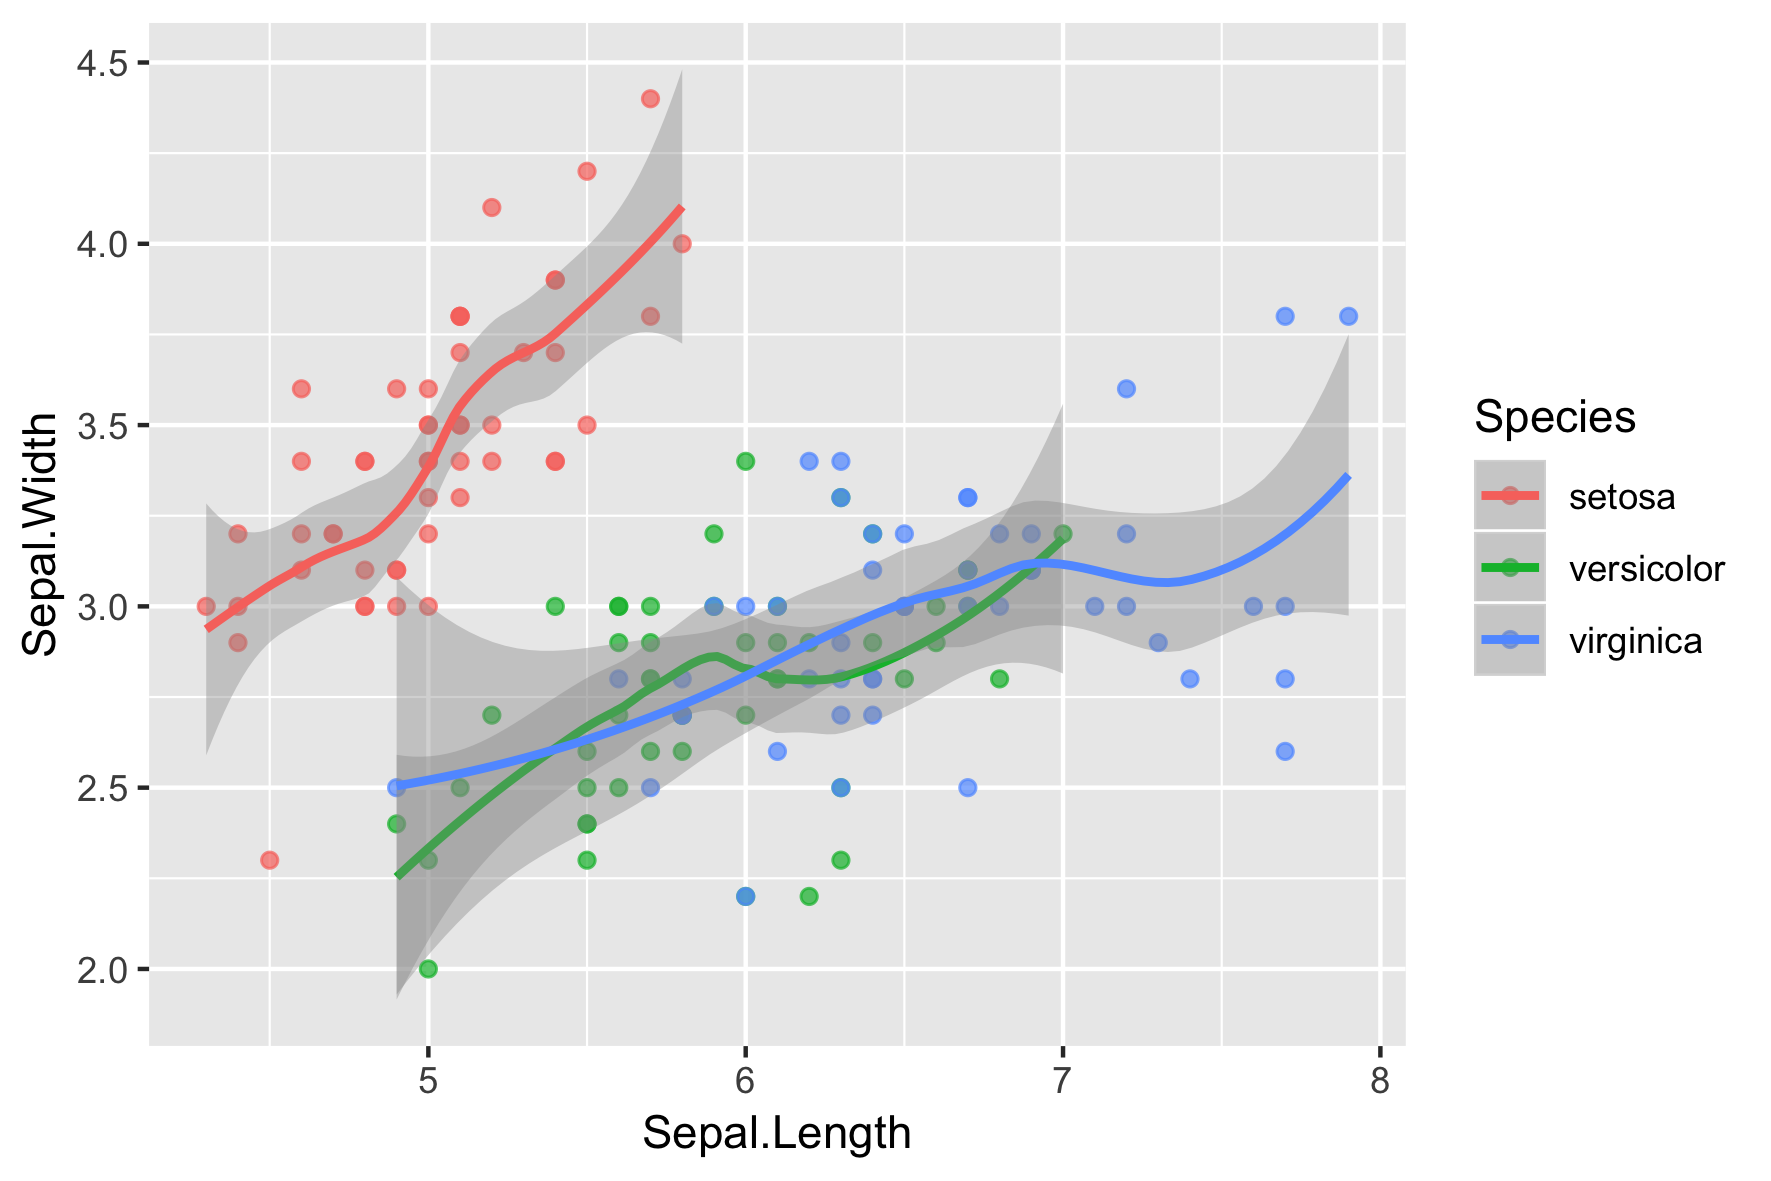
Original plot
scale_x_continuous()

scale_x_continuous()
Original plot
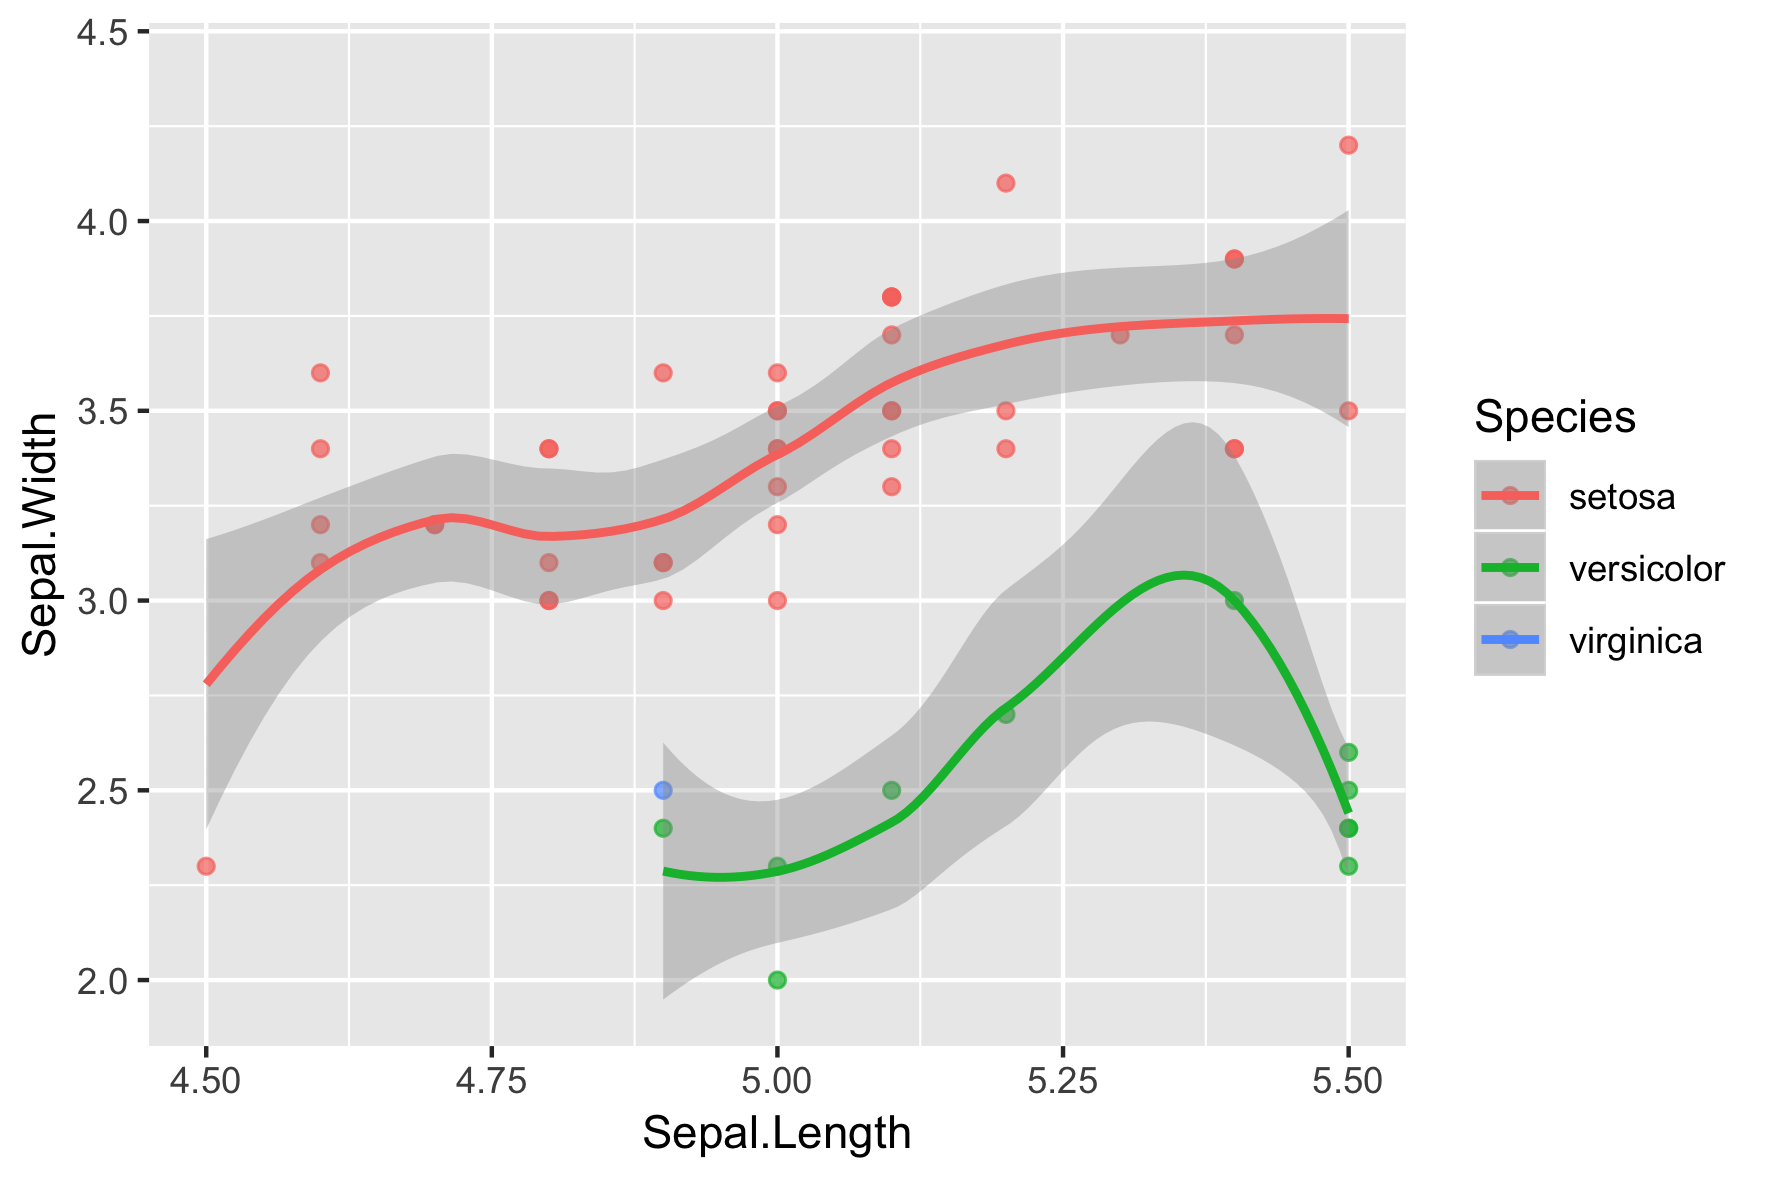
Zoom in with scale_x_continuous()
Part of original data is filtered out!
xlim()
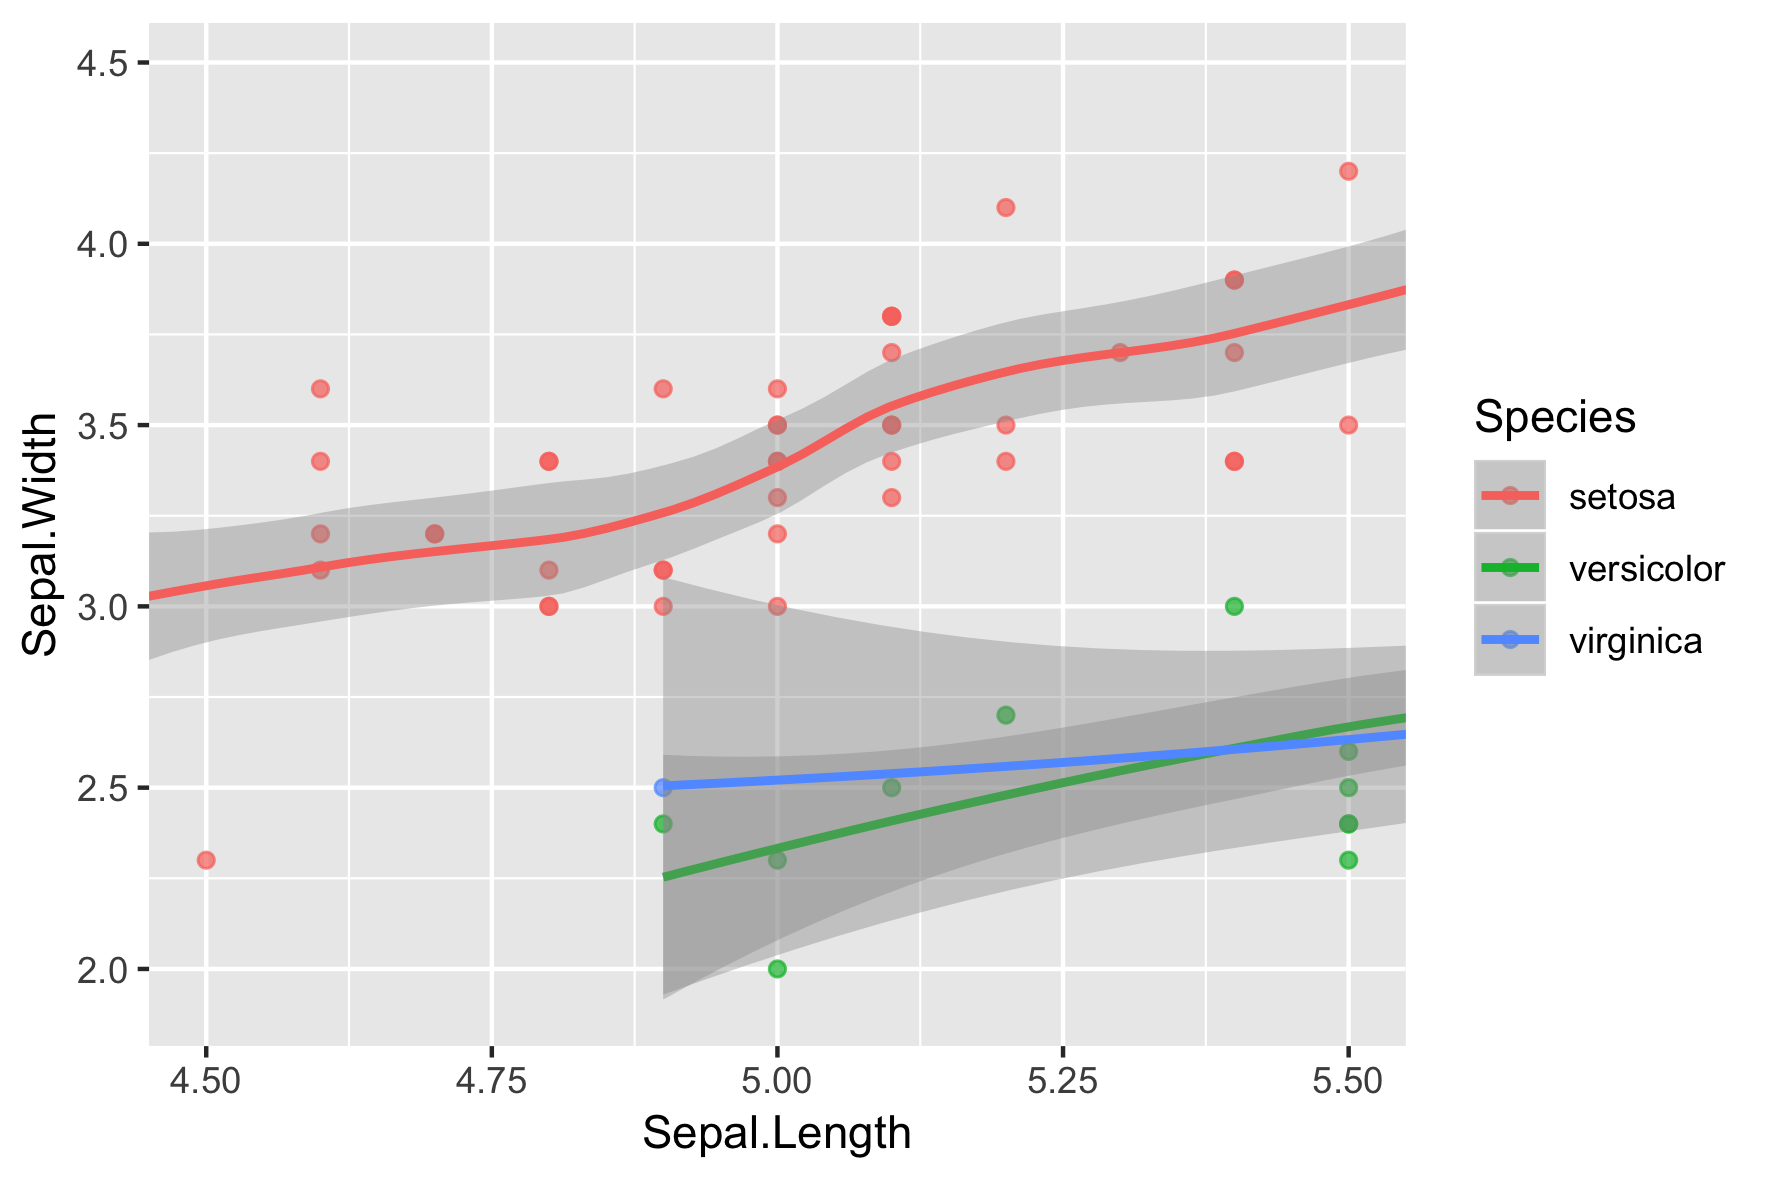
coord_cartesian()
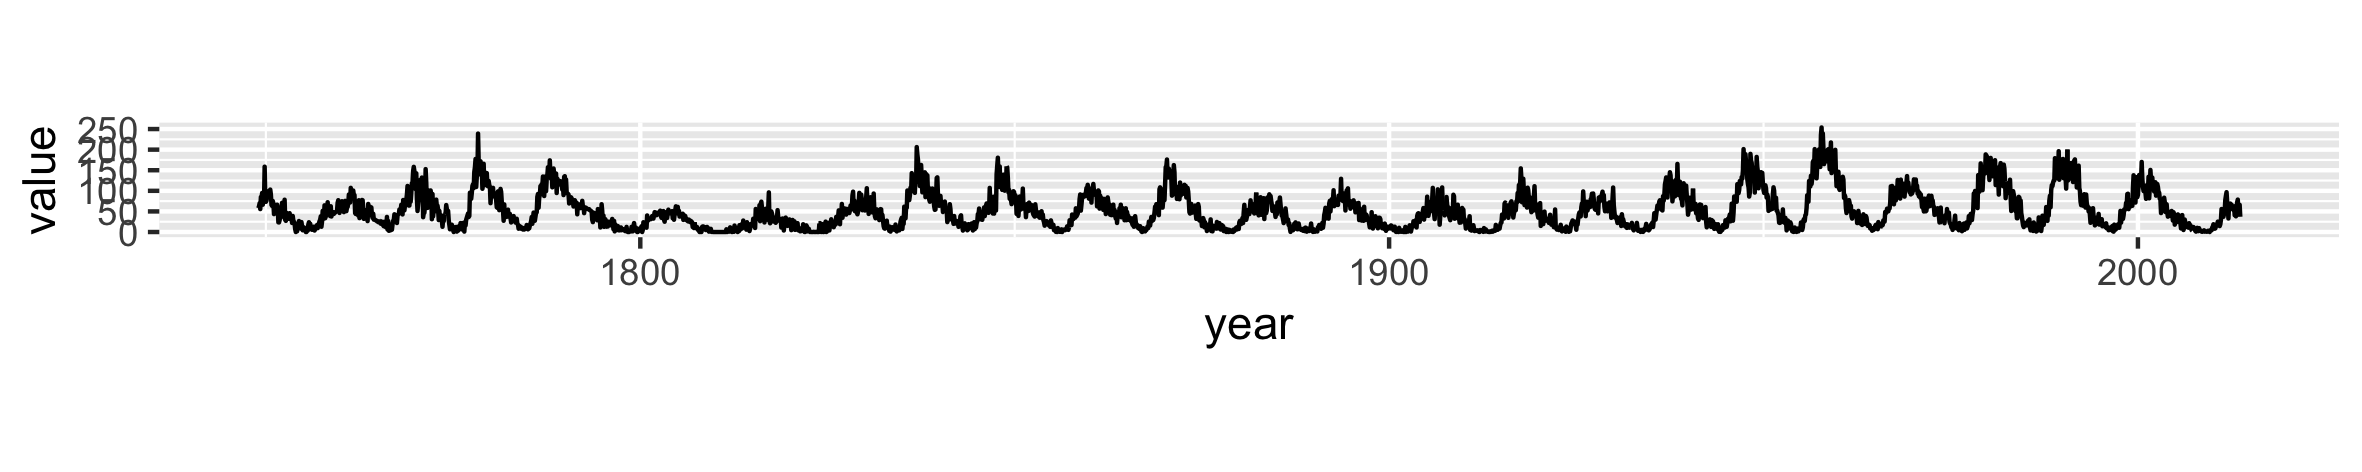
Sunspots
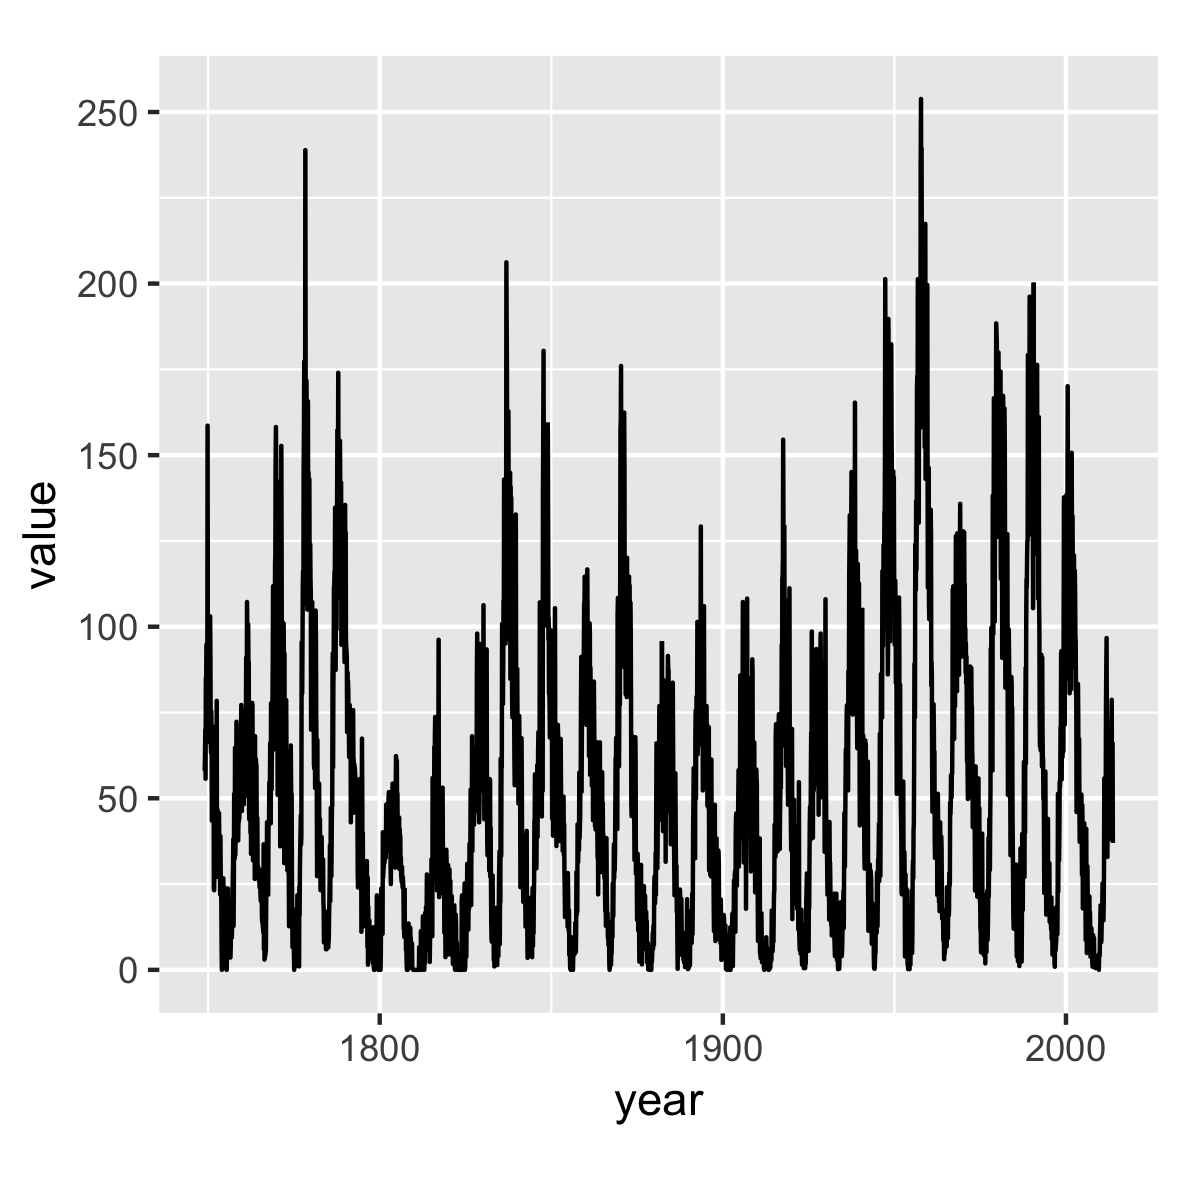
Sunspots