Facet wrap & margins
Intermediate Data Visualization with ggplot2

Rick Scavetta
Founder, Scavetta Academy
Adjusting the plotting space
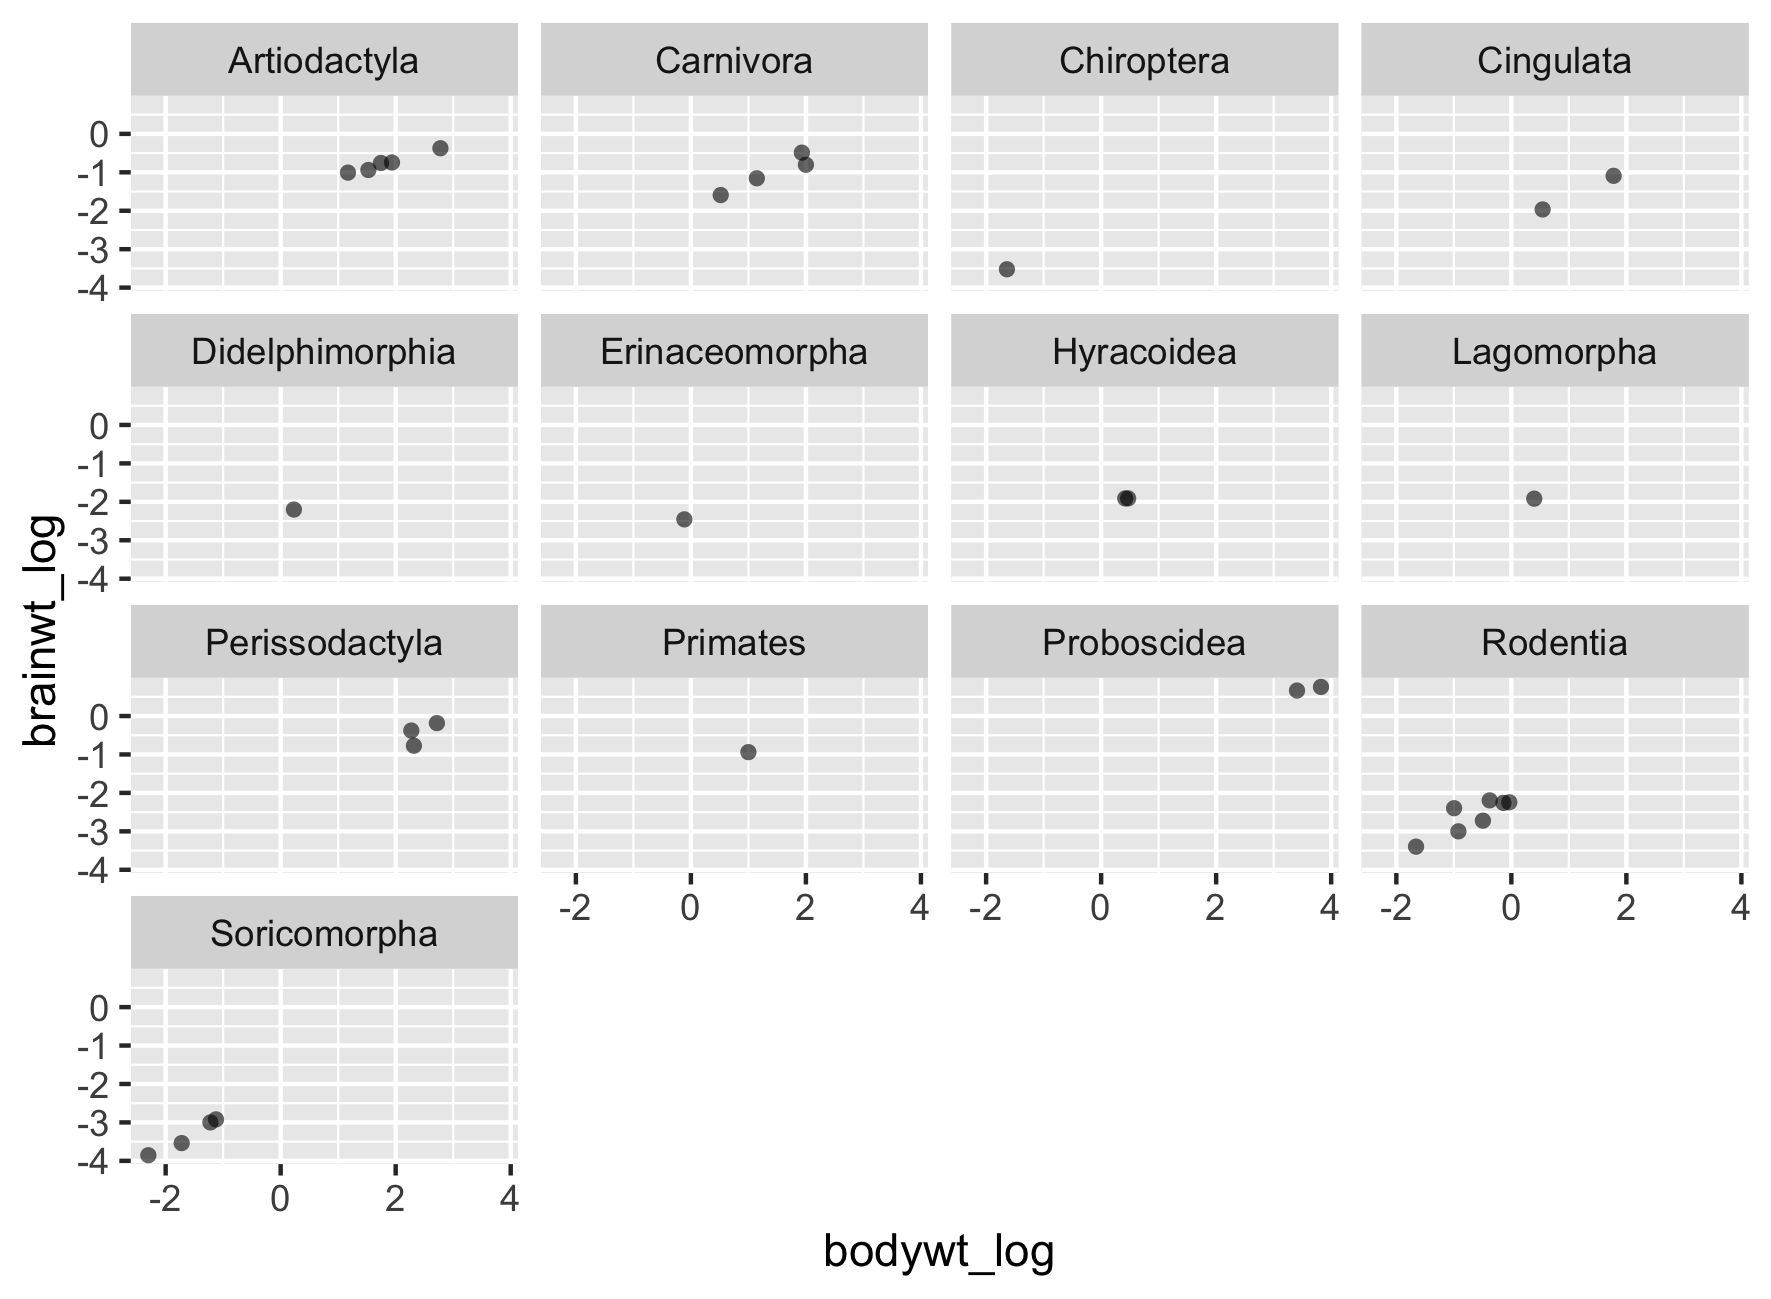
Using facet_wrap() - Scenario 1
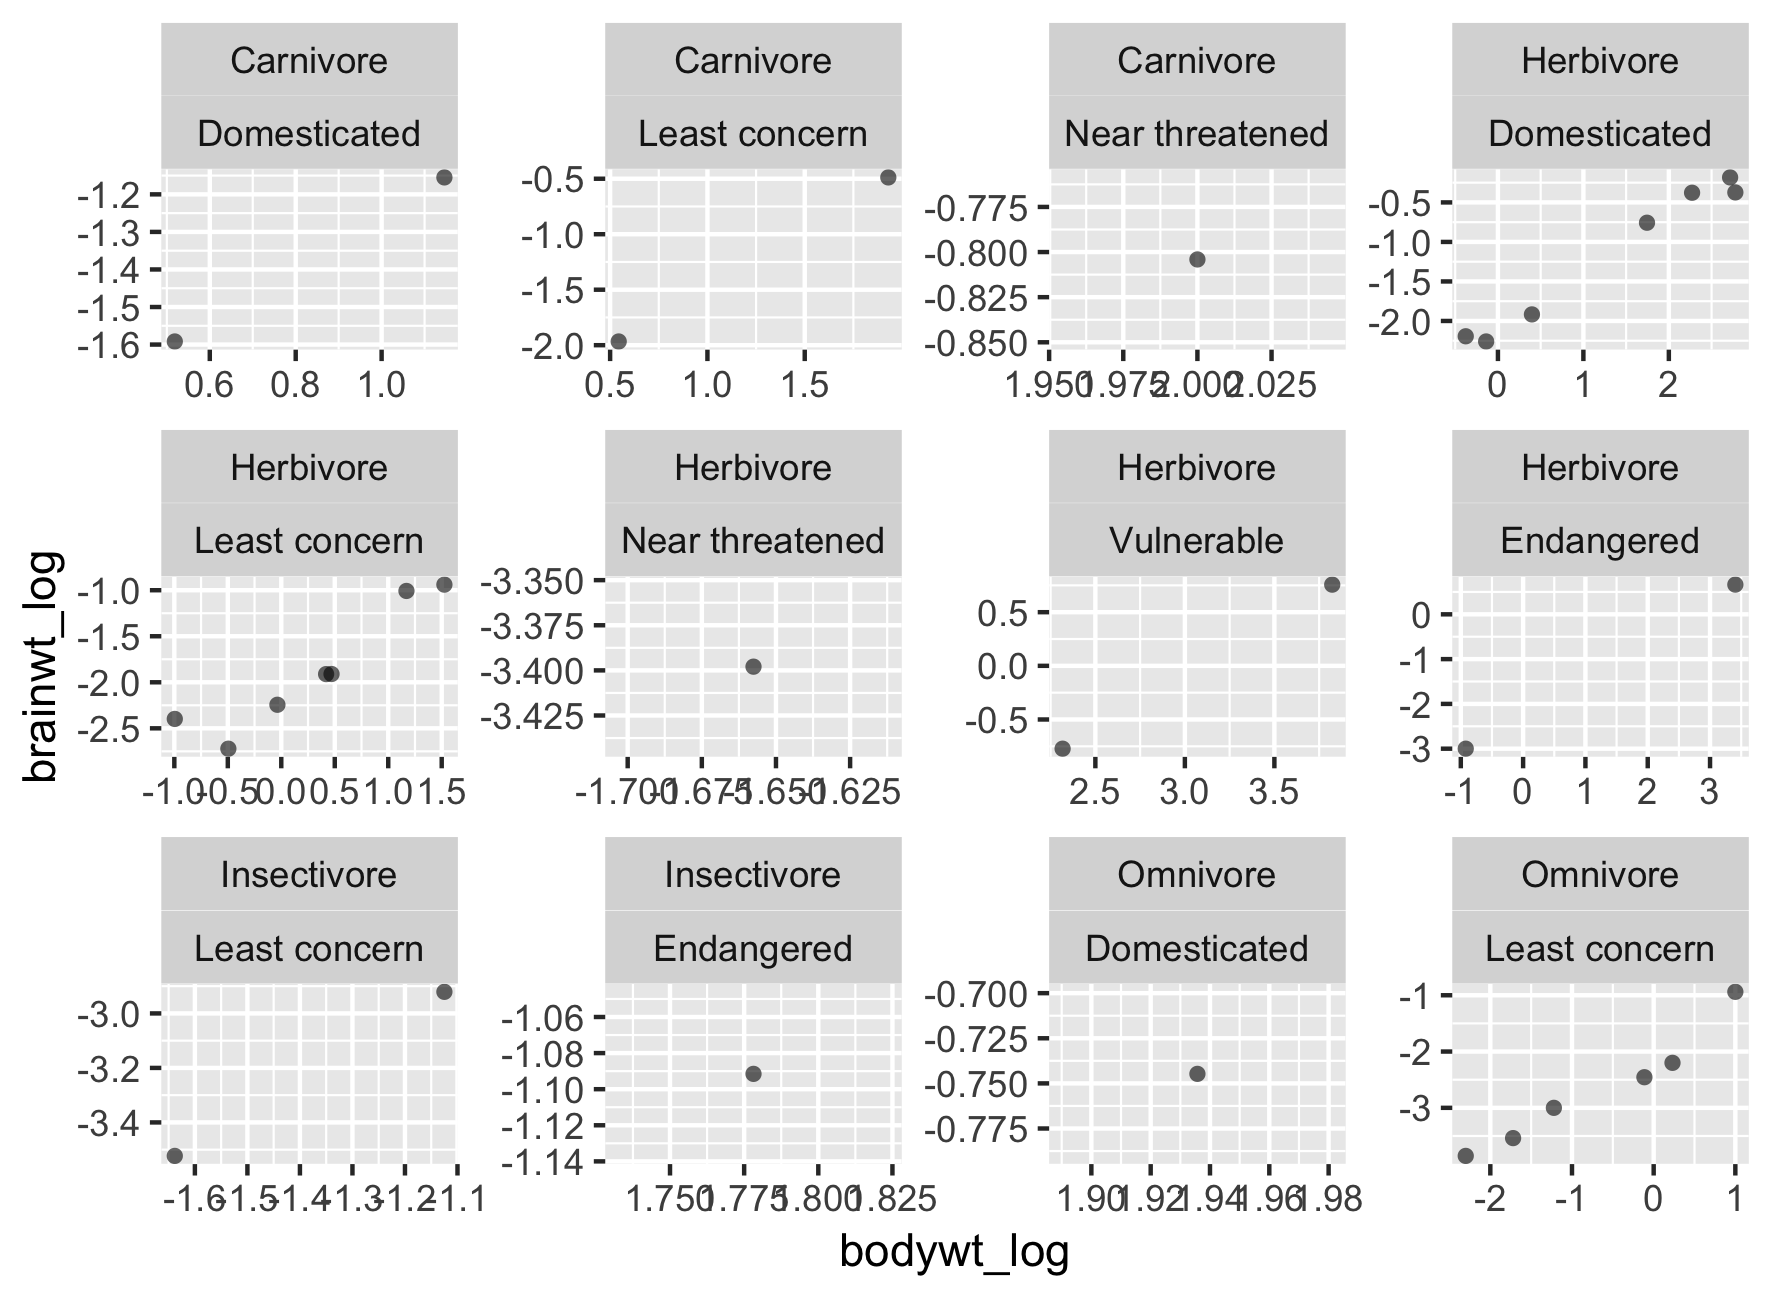
Using facet_wrap() - Scenario 2
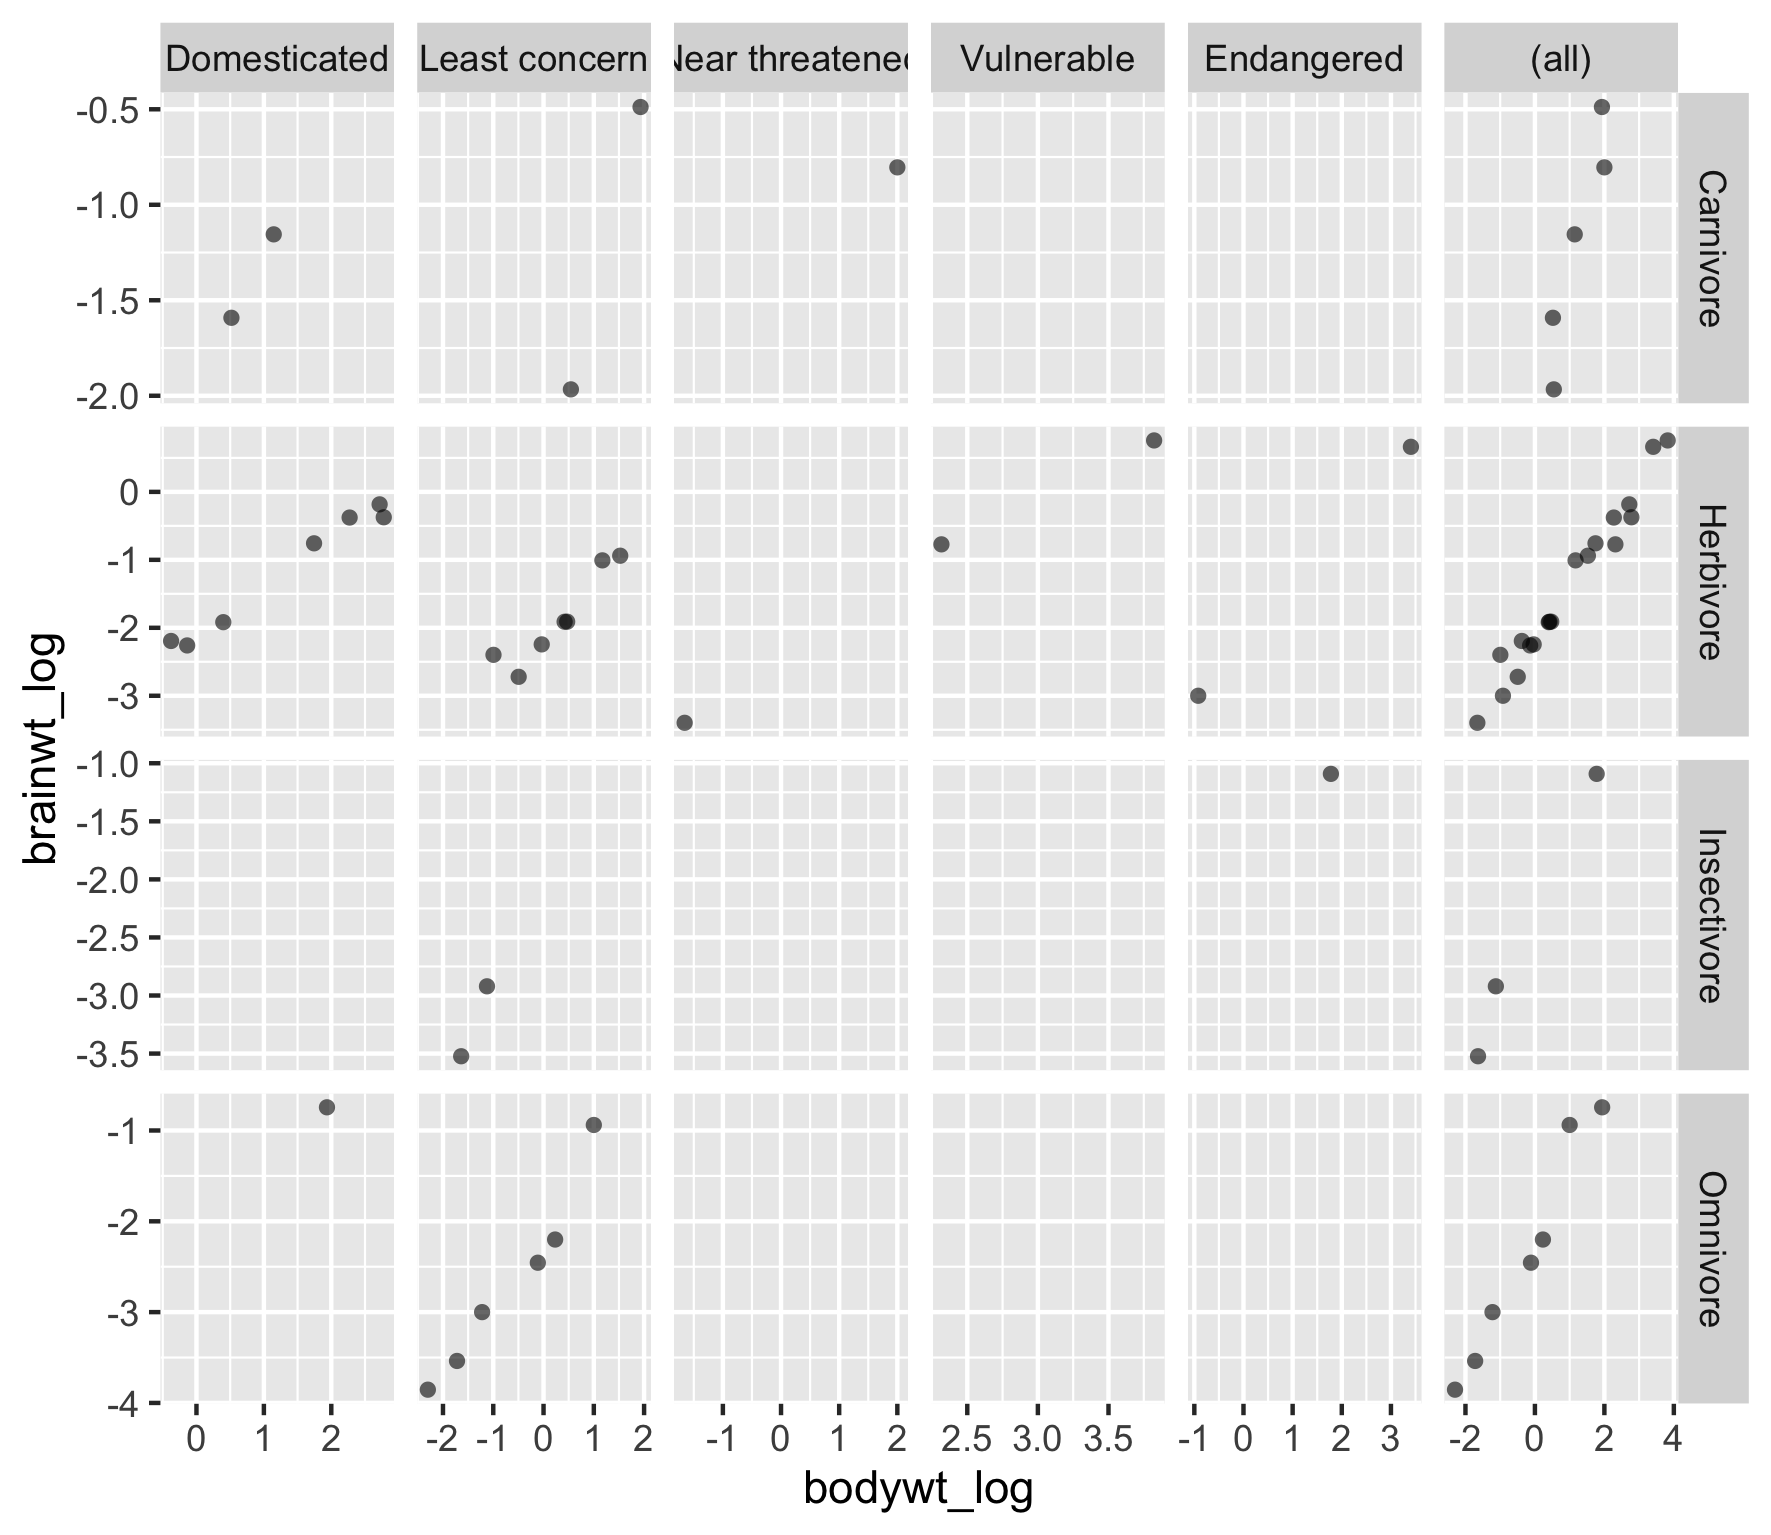
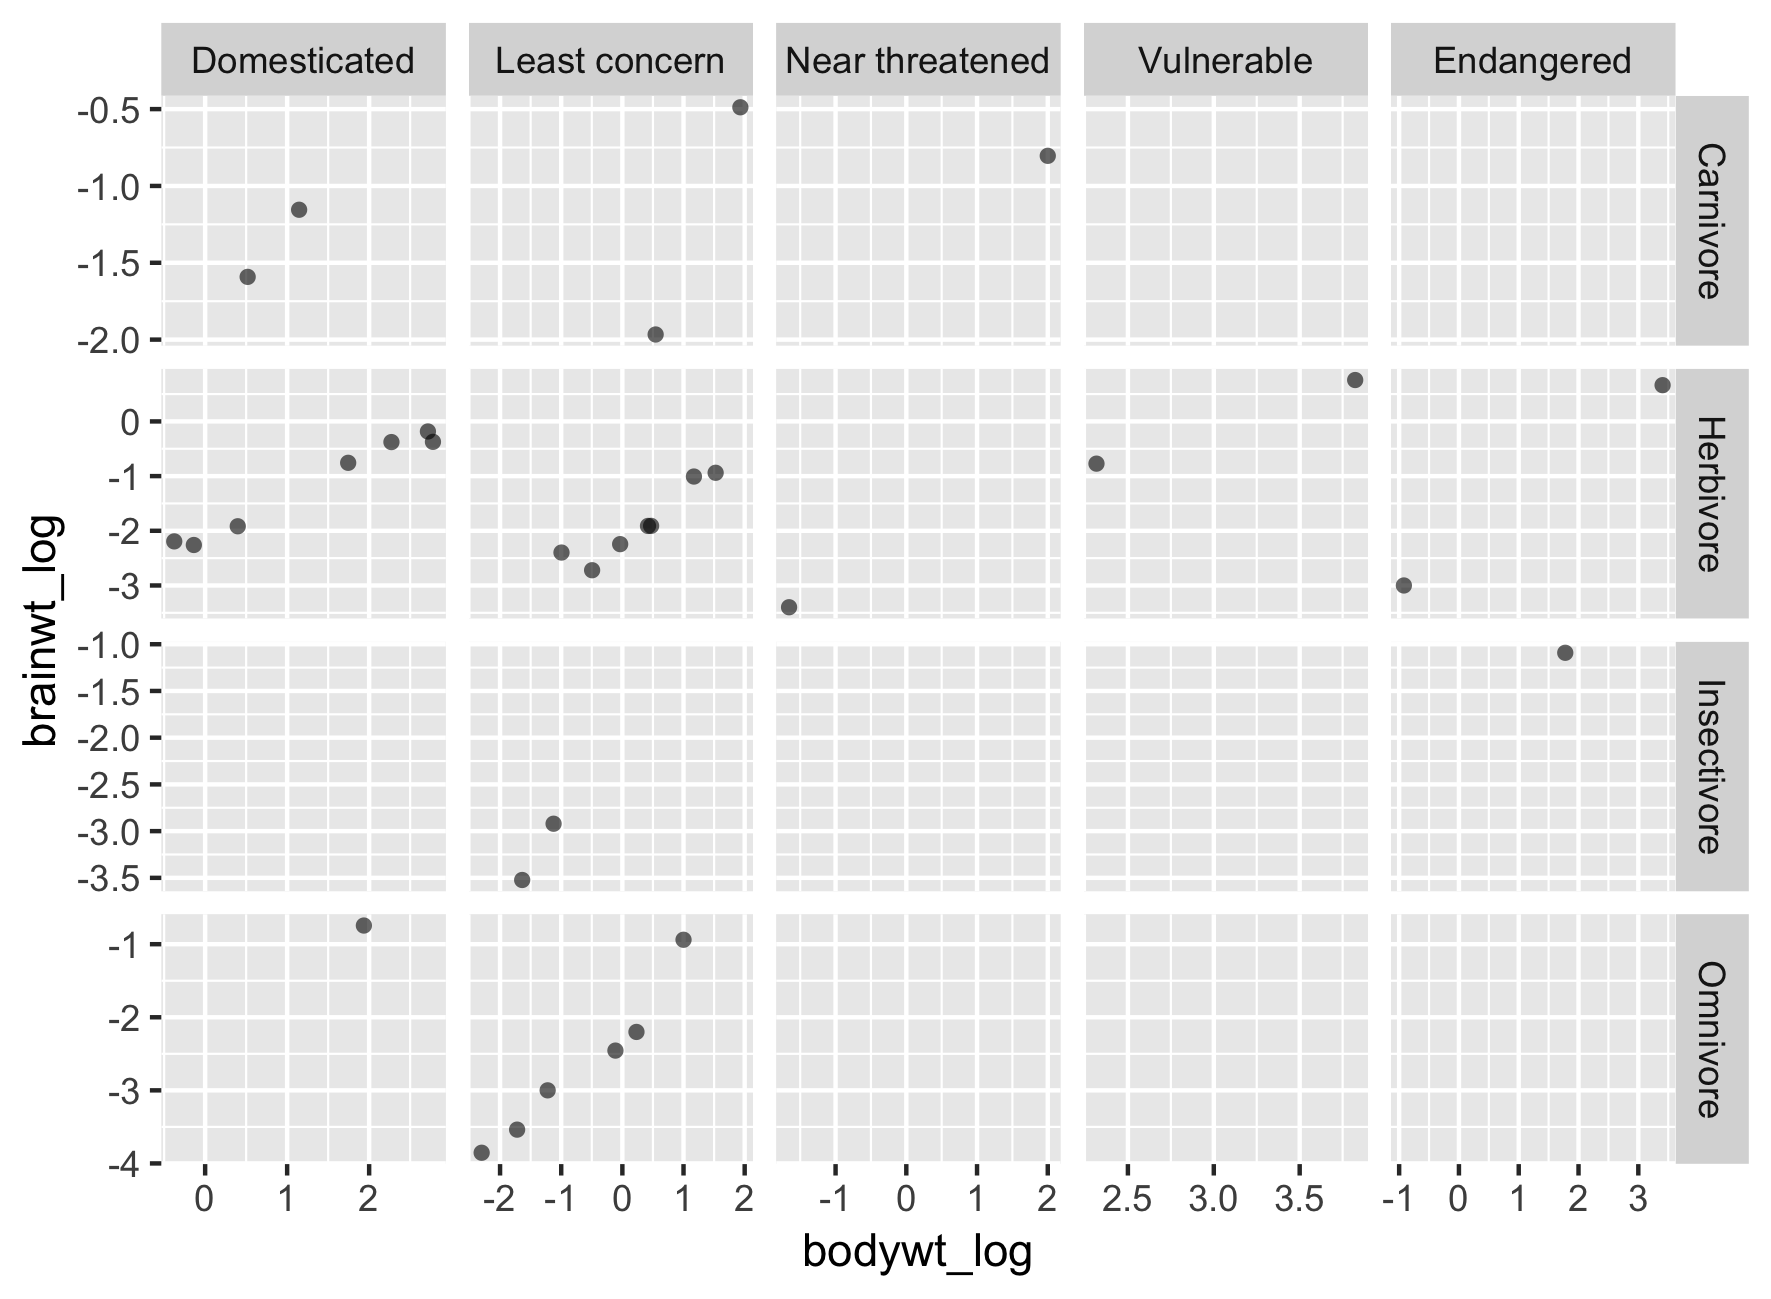
Using margin plots
Using margin plots
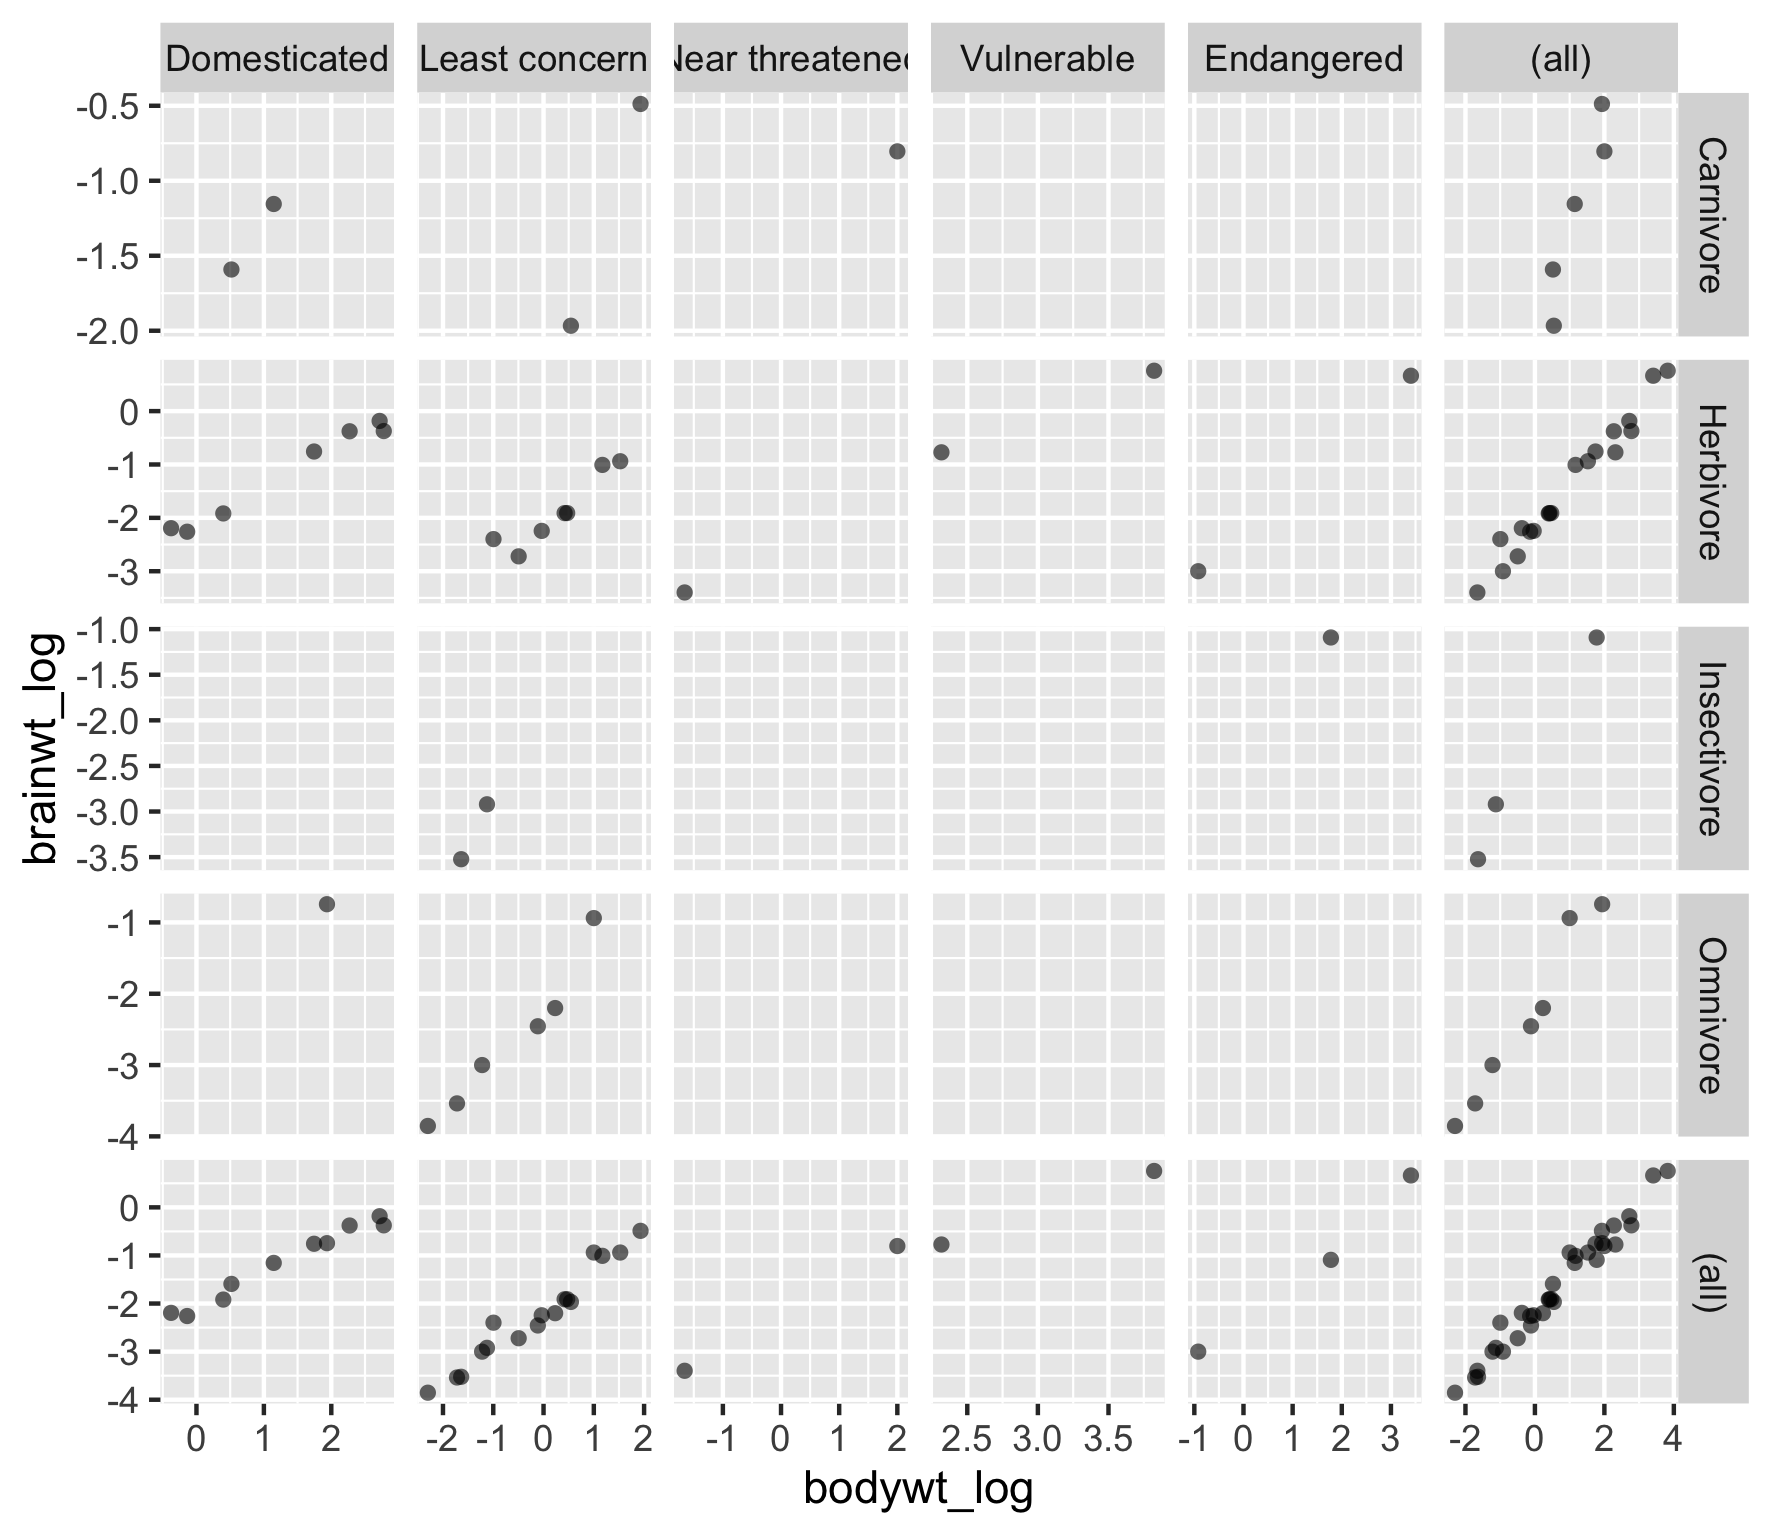
Using margin plots