Polar coordinates
Intermediate Data Visualization with ggplot2

Rick Scavetta
Founder, Scavetta Academy
Projections control perception
Projections control perception
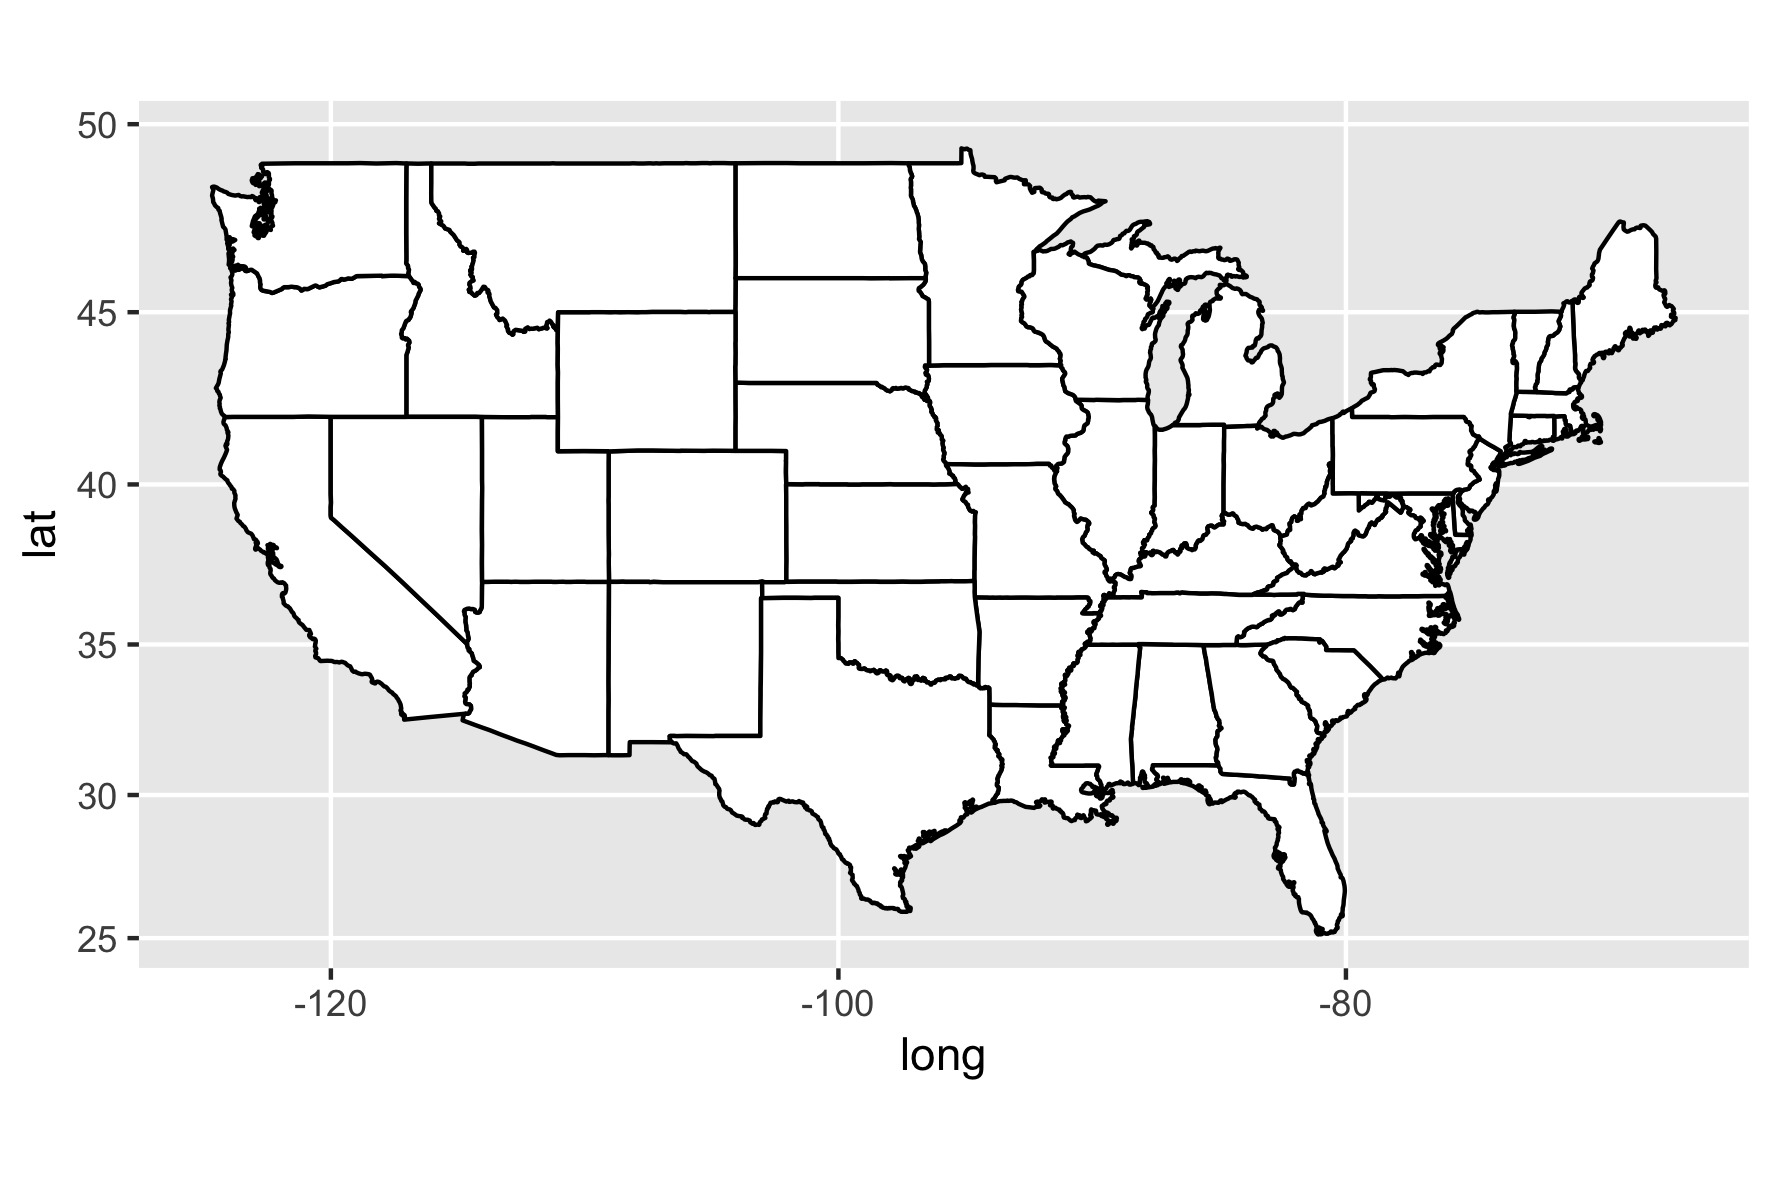
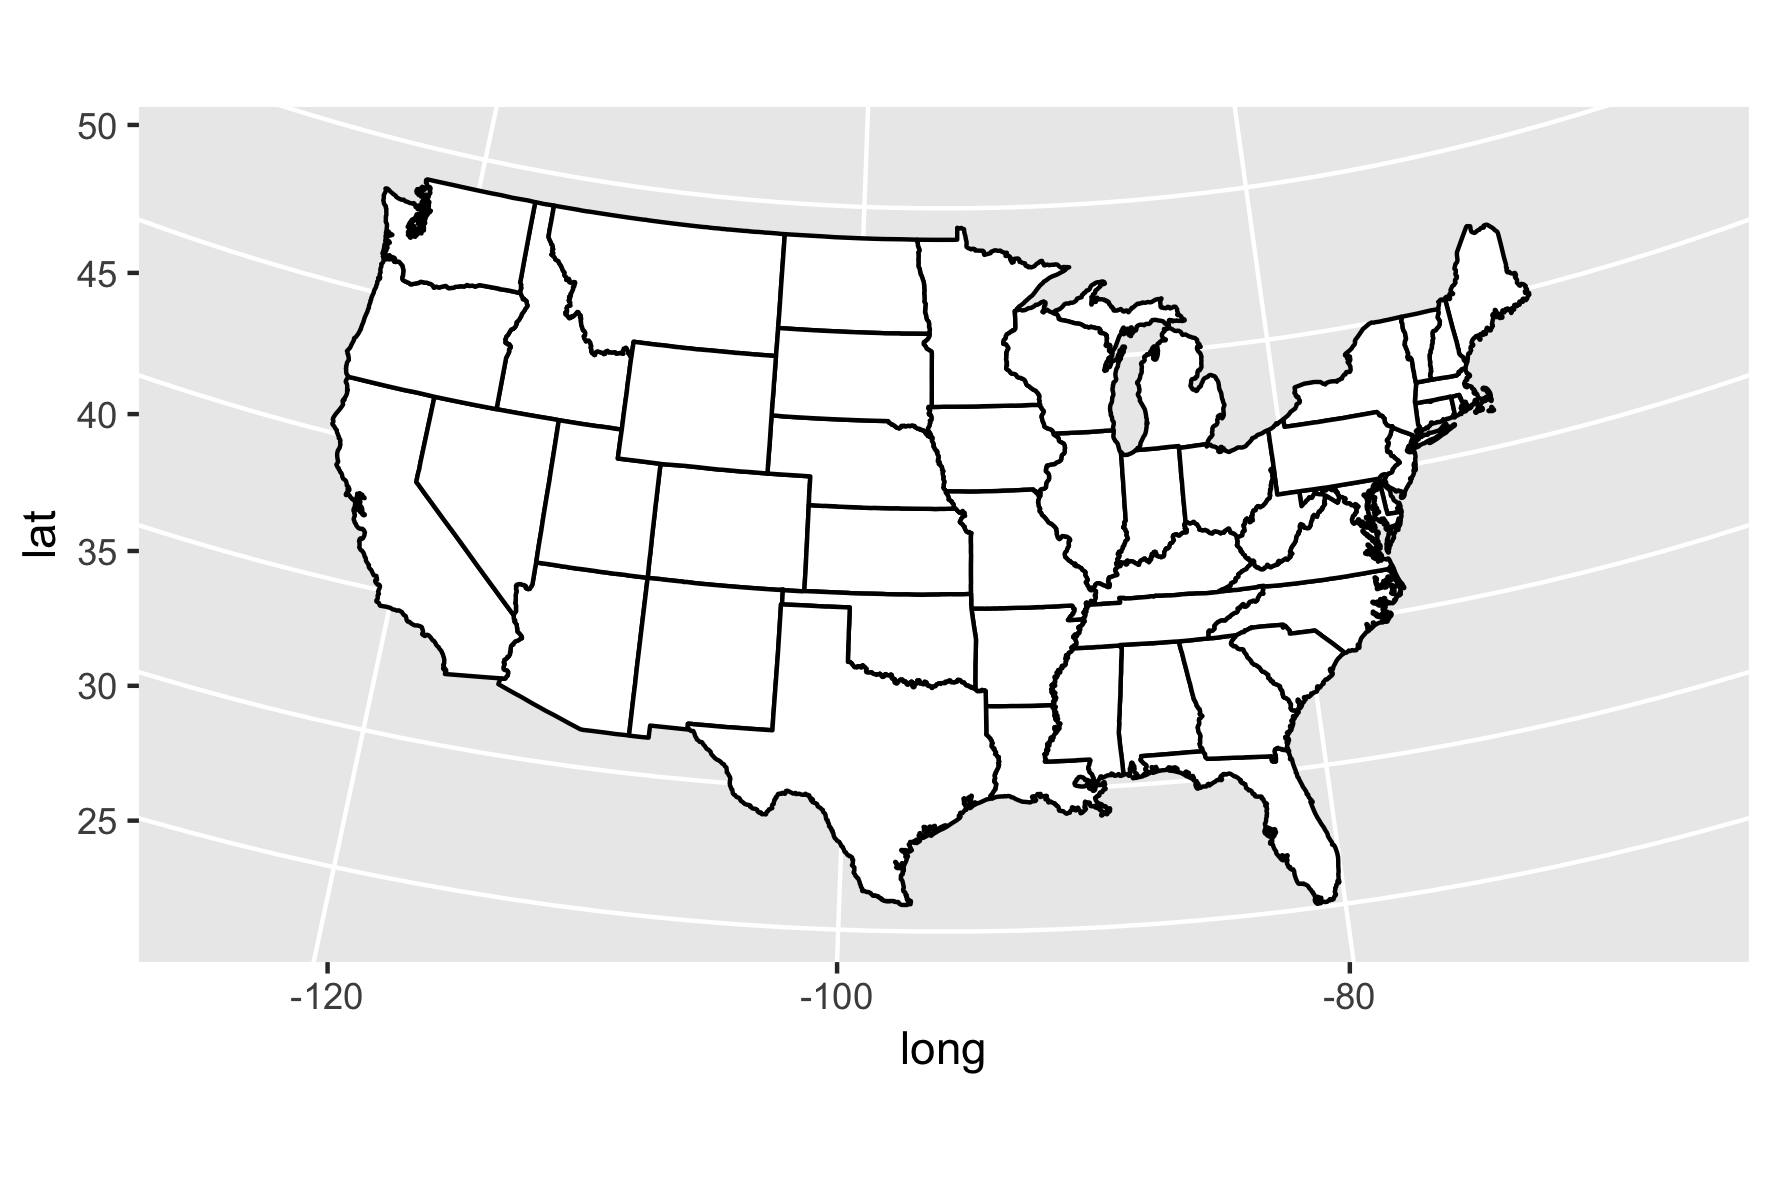
A preview of map projections
The Mercator Projection
The Conic Projection
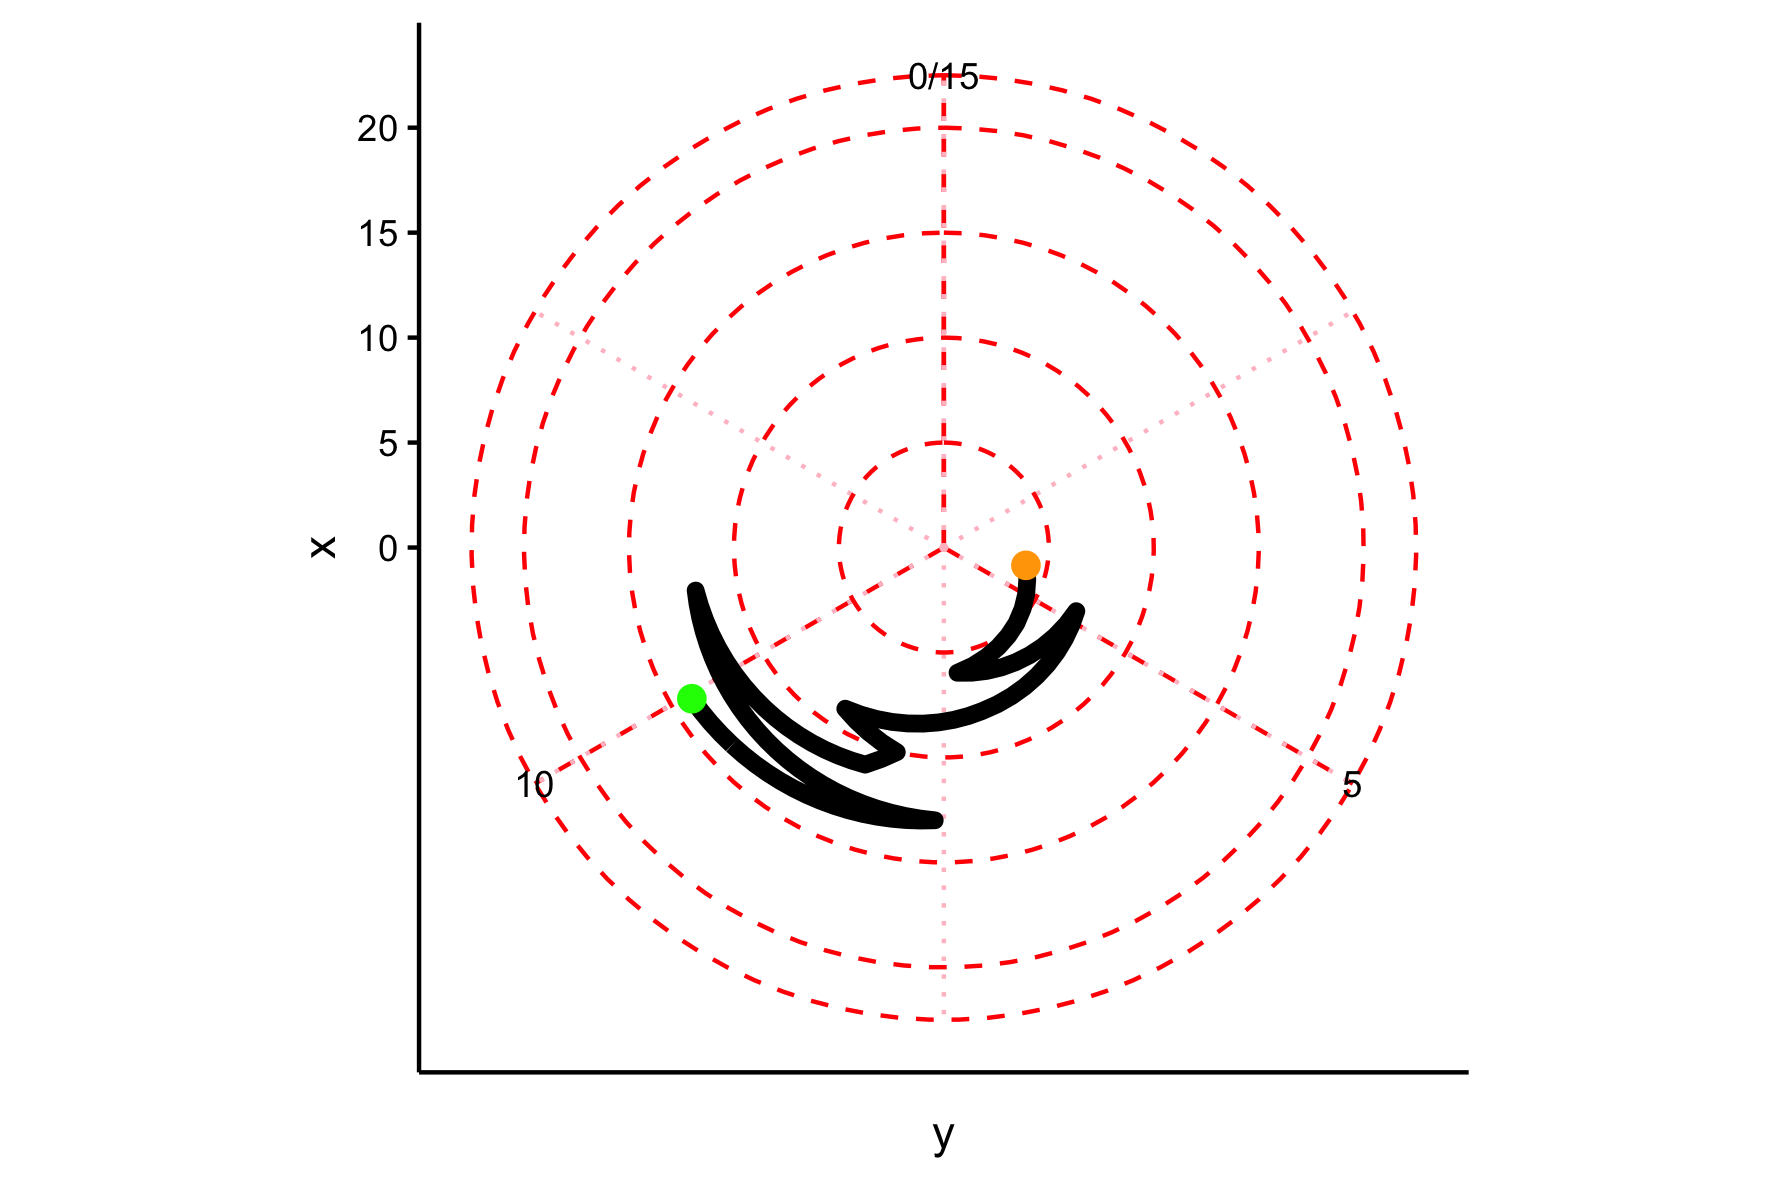
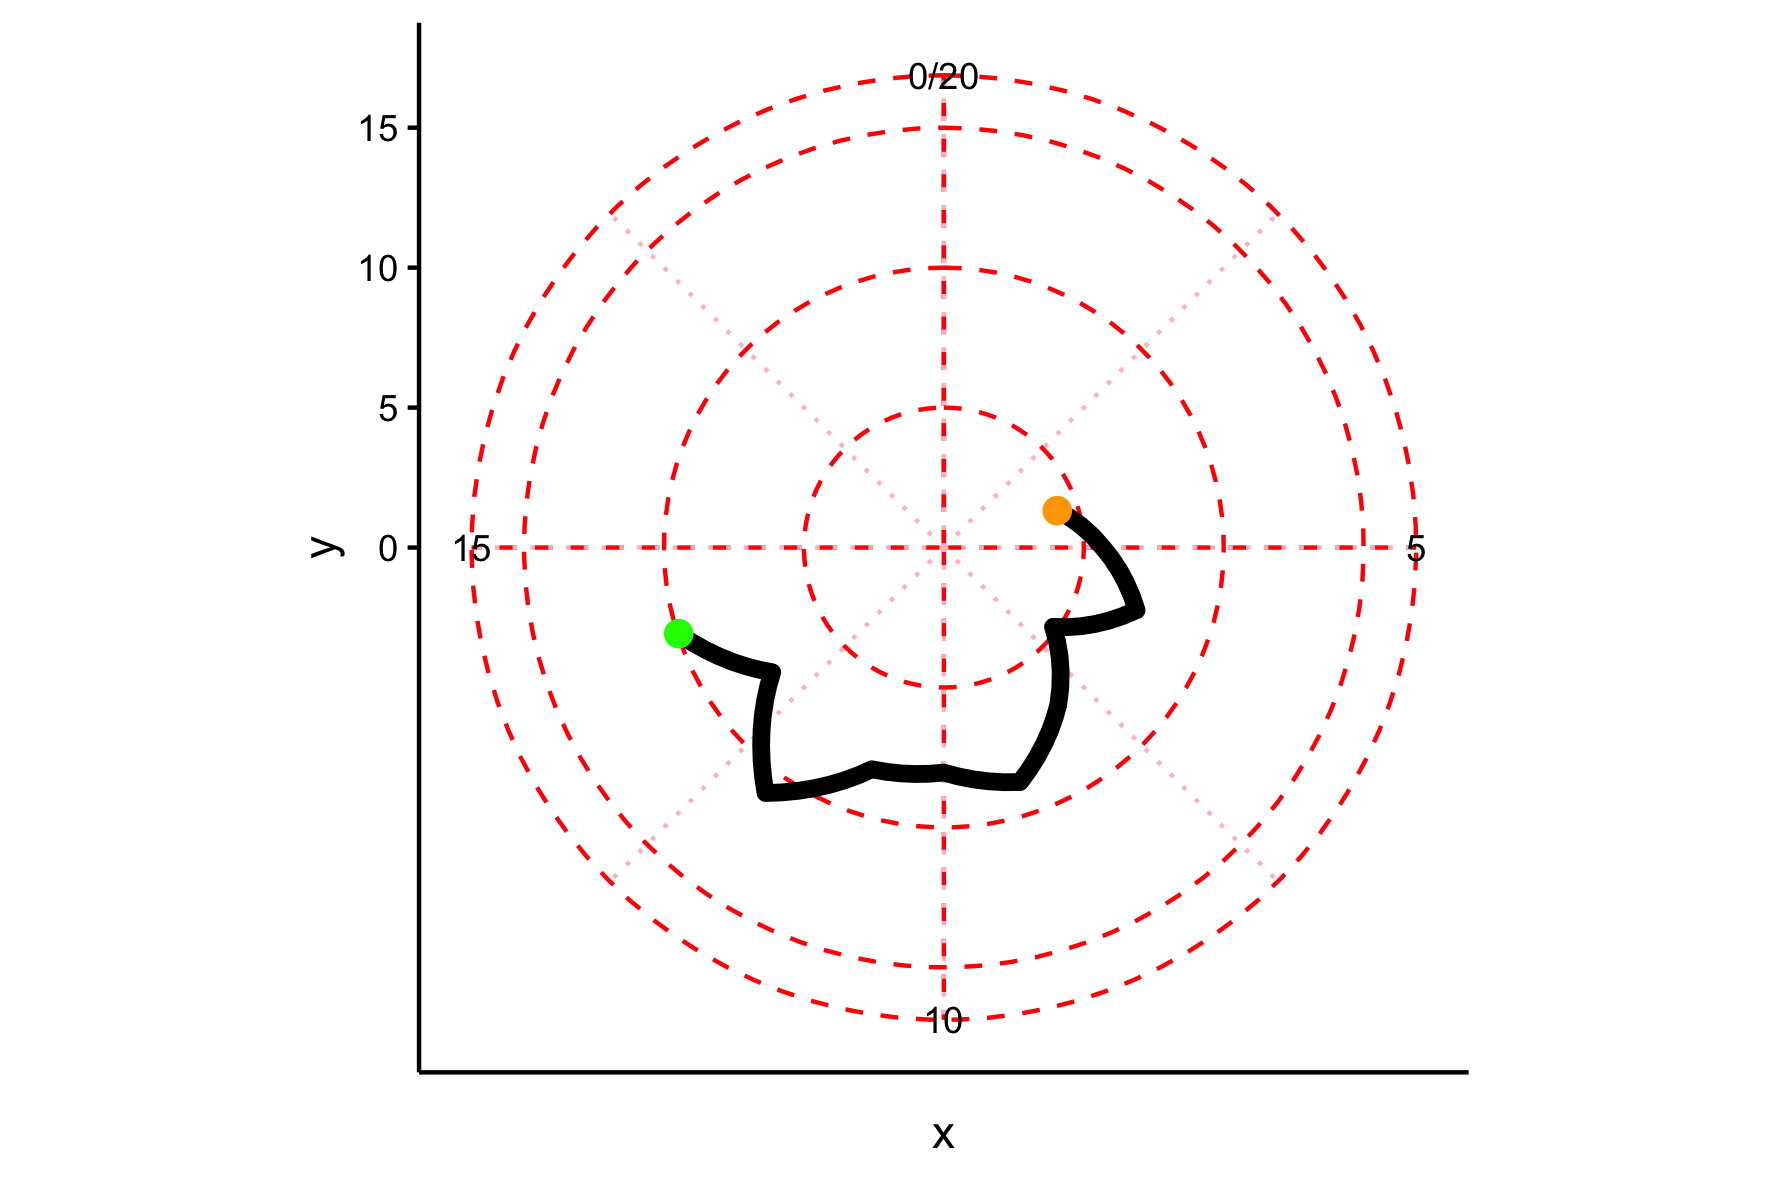
coord_polar()
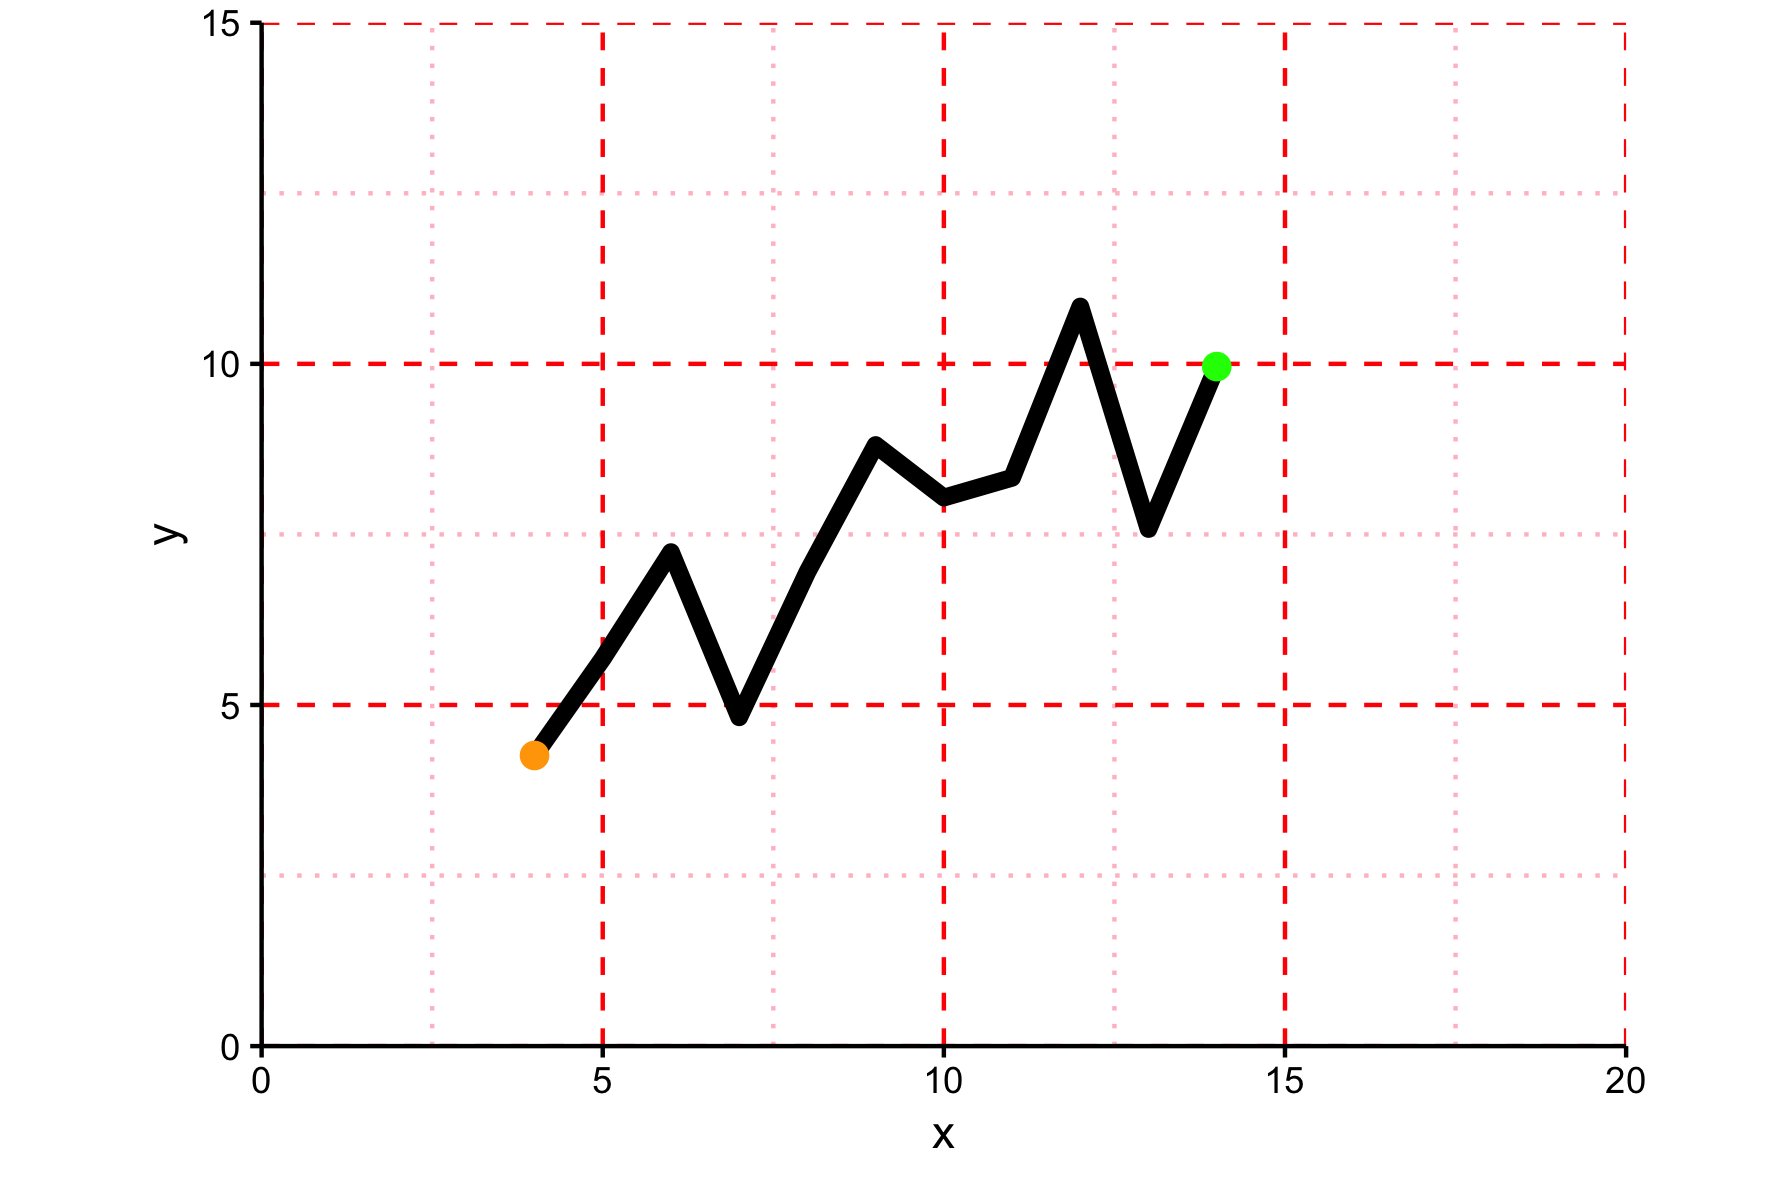
p + coord_fixed()
p + coord_polar()
coord_polar(theta = "y")
p + coord_fixed()
p + coord_polar(theta = "y")