Double and flipped axes
Intermediate Data Visualization with ggplot2

Rick Scavetta
Founder, Scavetta Academy
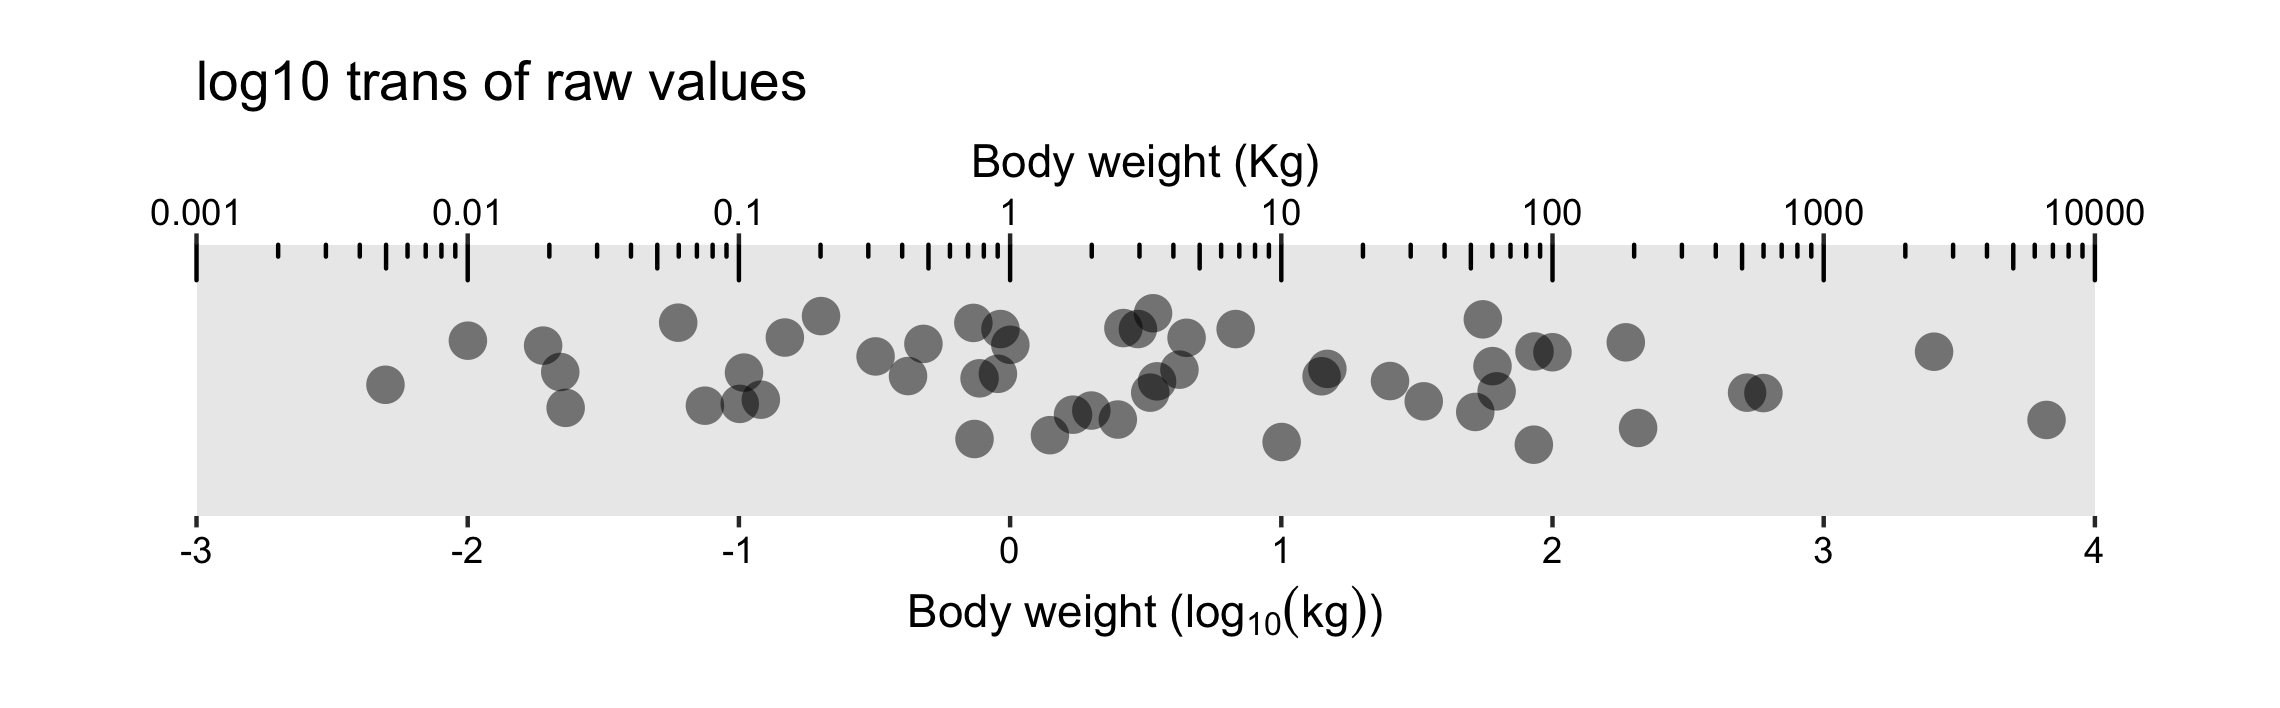
Double axes
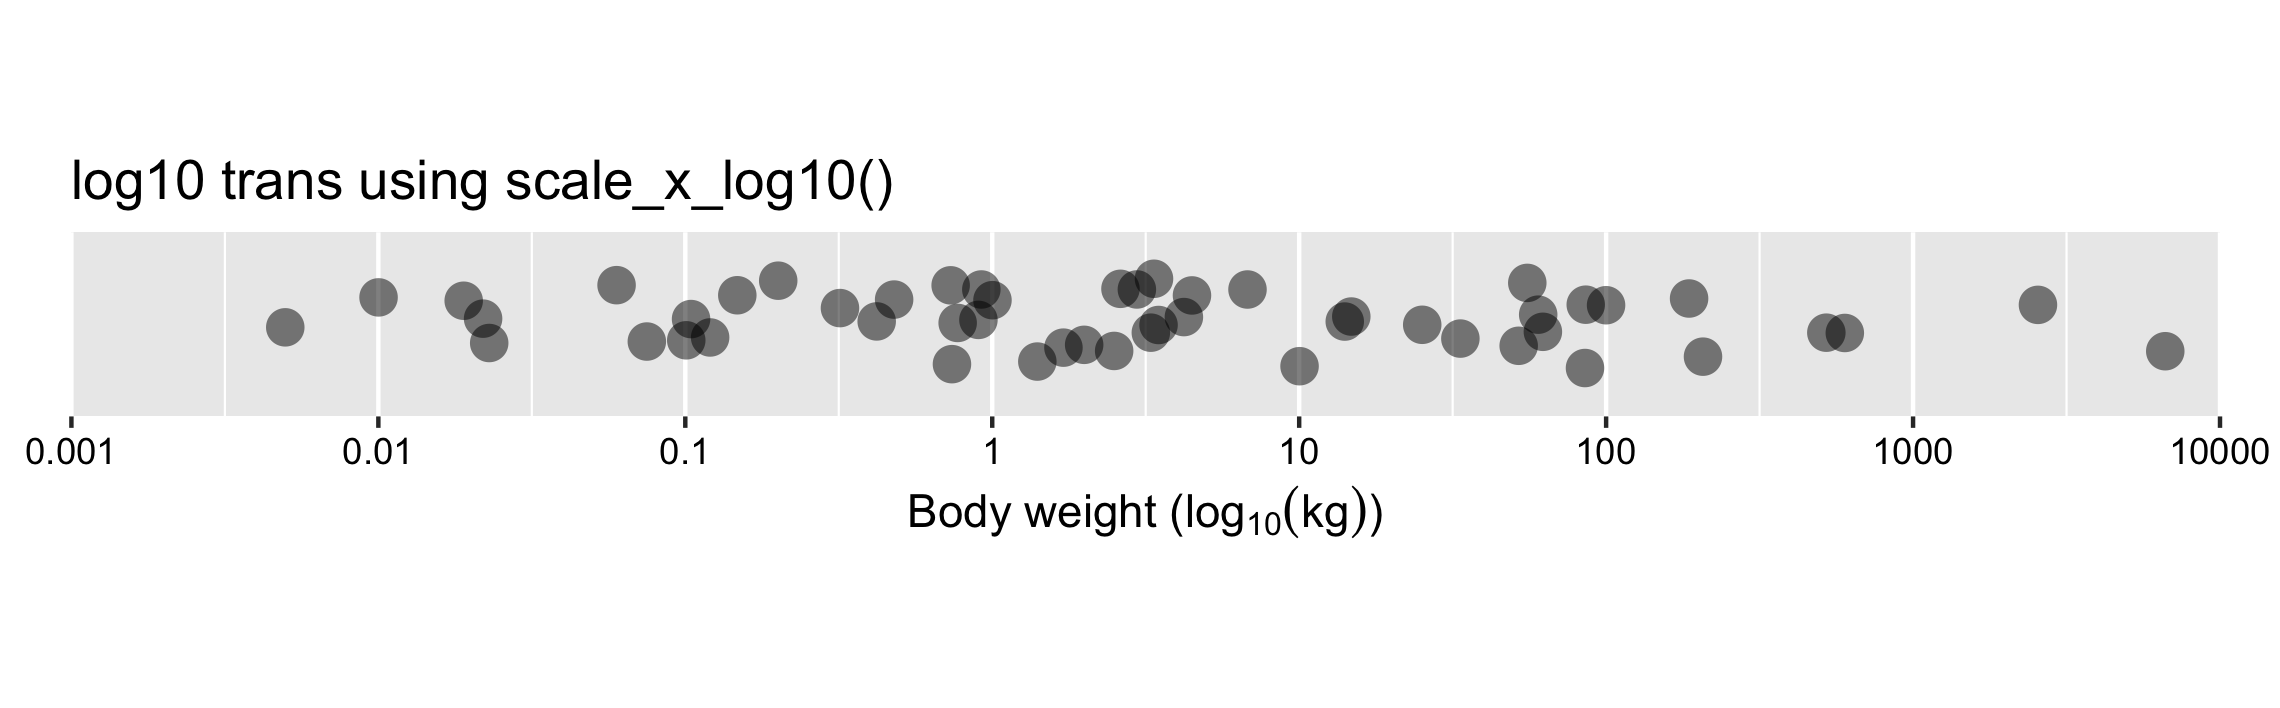
Adding raw and transformed axes
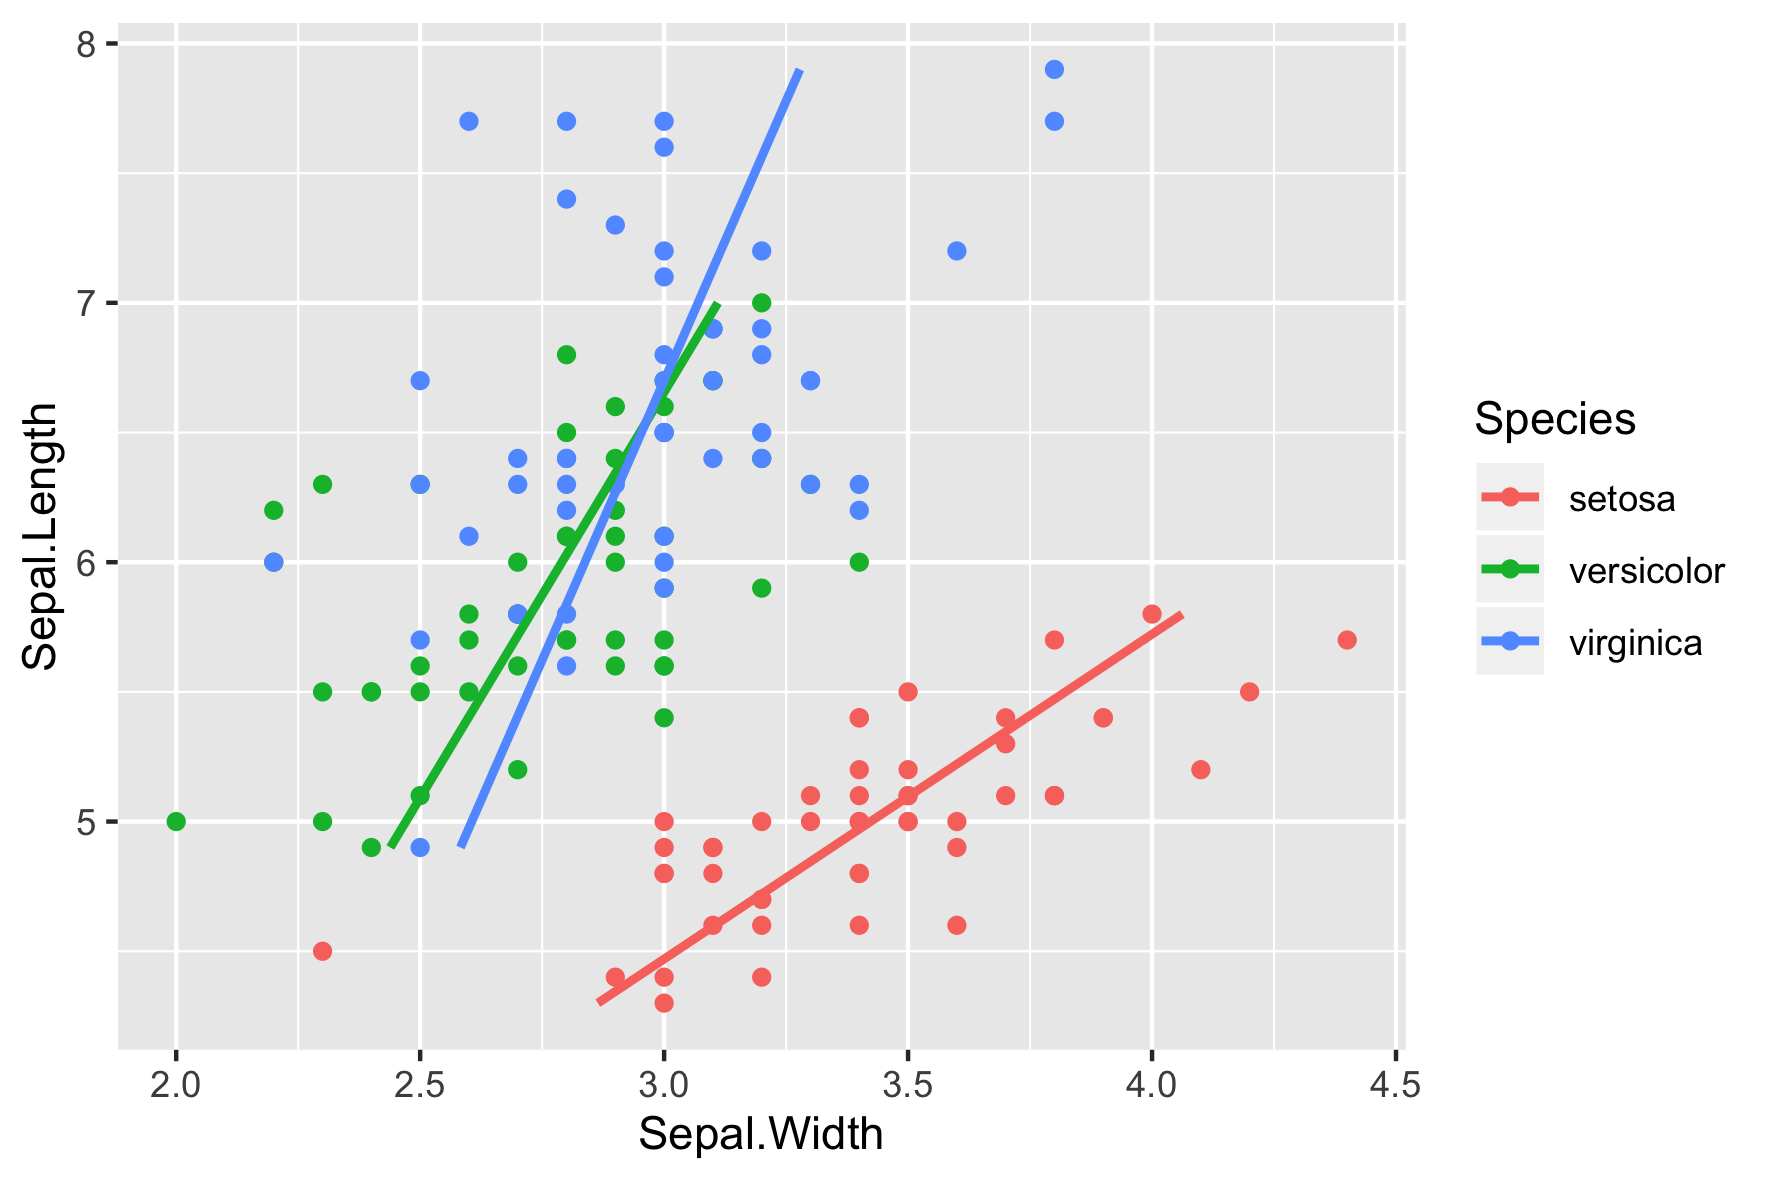
Flipping axes
coord_flip()
Intermediate Data Visualization with ggplot2
Rick Scavetta
Founder, Scavetta Academy

