Distribution assumptions

GARCH Models in Python

Chelsea Yang

Data Science Instructor

Why make assumptions

  • Volatility is not directly observable

  • GARCH model use residuals as volatility shocks $$ r_t = \mu_t + \epsilon_t $$

  • Volatility is related to the residuals: $$ \epsilon_t = \sigma_t * \zeta (WhiteNoise)$$

GARCH Models in Python

Standardized residuals

  • Residual = predicted return - mean return $$ residuals = \epsilon_t = r_t - \mu_t $$
  • Standardized residual = residual / return volatility $$ std\,Resid = \frac{\epsilon_t}{\sigma_t} $$
GARCH Models in Python

Residuals in GARCH

gm_std_resid = gm_result.resid / gm_result.conditional_volatility
plt.hist(gm_std_resid, facecolor = 'orange',label = 'standardized residuals')
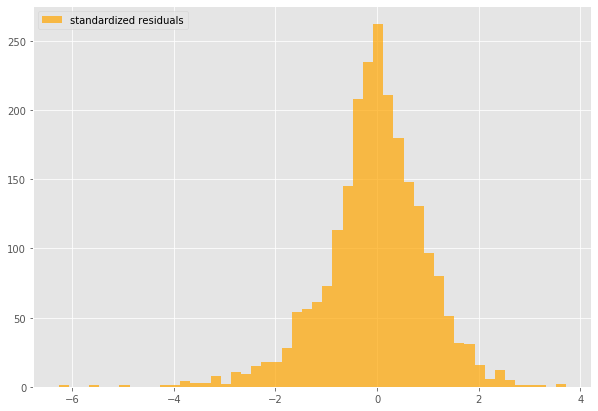
Histogram of standardized residuals

GARCH Models in Python

Fat tails

  • Higher probability to observe large (positive or negative) returns than under a normal distribution
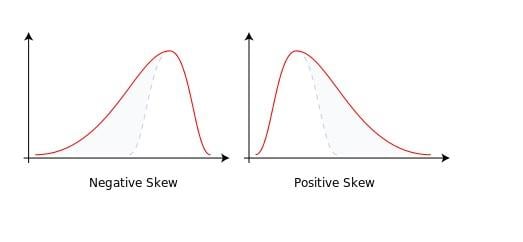
Fat tail example

GARCH Models in Python

Skewness

  • Measure of asymmetry of a probability distribution

Example of skewness

GARCH Models in Python

Student's t-distribution

t-distribution example

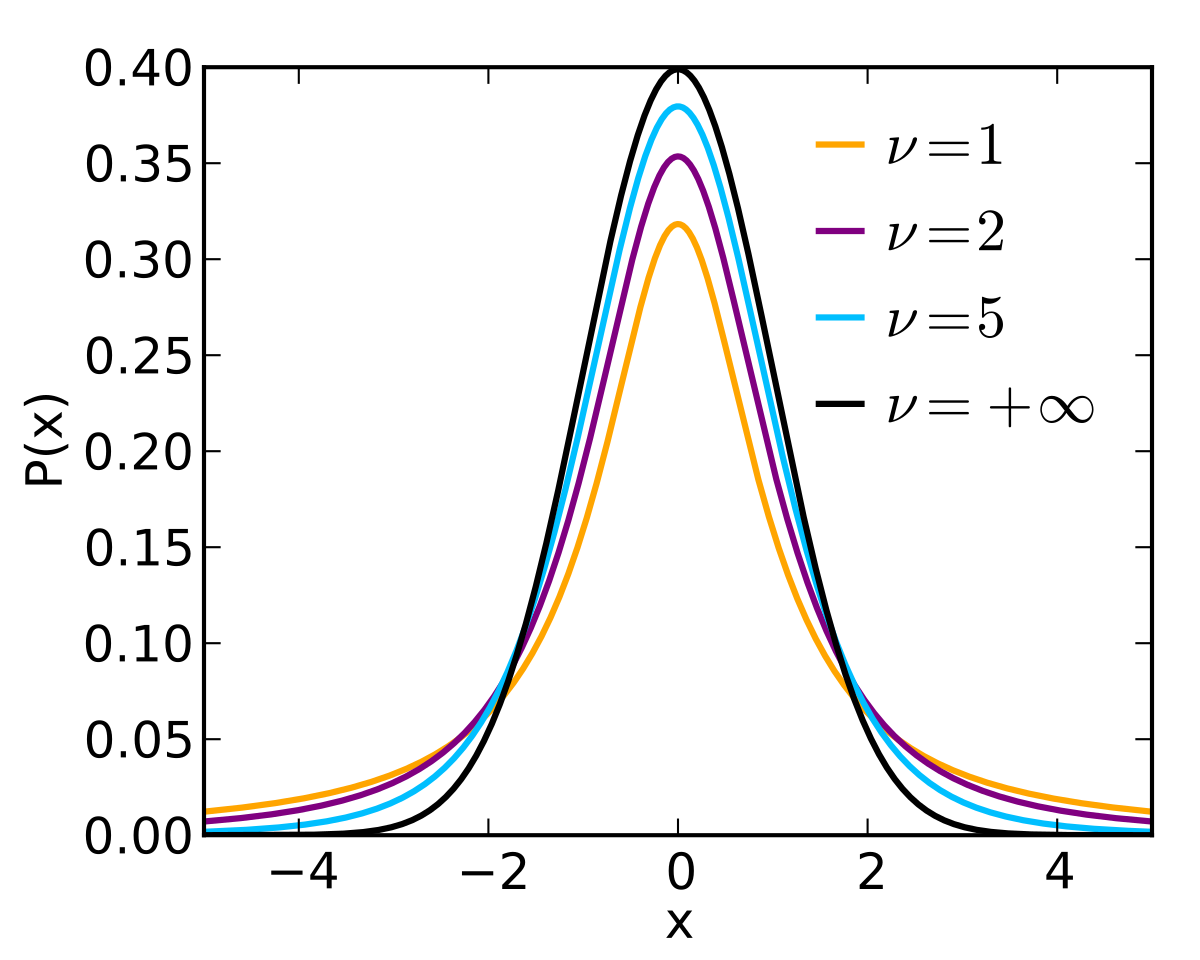
$\nu$ parameter of a Student's t-distribution indicates its shape

GARCH Models in Python

GARCH with t-distribution

arch_model(my_data, p = 1, q = 1,
           mean = 'constant', vol = 'GARCH', 
           dist = 't')
                              Distribution                              
========================================================================
                 coef    std err          t      P>|t|  95.0% Conf. Int.
.-----------------------------------------------------------------------
nu             4.9249      0.507      9.709  2.768e-22 [  3.931,  5.919]
========================================================================
GARCH Models in Python

GARCH with skewed t-distribution

arch_model(my_data, p = 1, q = 1,
           mean = 'constant', vol = 'GARCH', 
           dist = 'skewt')
                                Distribution                               
===========================================================================
                 coef    std err          t      P>|t|     95.0% Conf. Int.
.--------------------------------------------------------------------------
nu             5.2437      0.575      9.118  7.681e-20    [  4.117,  6.371]
lambda        -0.0822  2.541e-02     -3.235  1.216e-03 [ -0.132,-3.241e-02]
===========================================================================
GARCH Models in Python

Let's practice!

GARCH Models in Python

Preparing Video For Download...