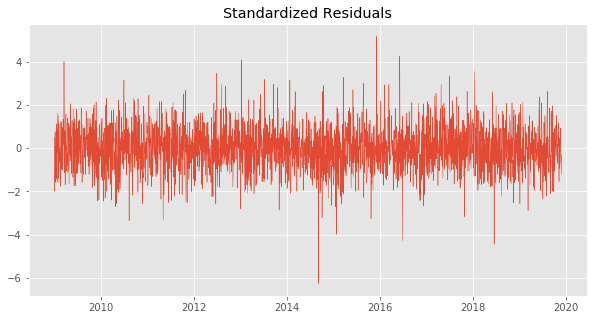
Validation of GARCH model assumptions

GARCH Models in Python

Chelsea Yang

Data Science Instructor

Visual check

Raw return data

Standardized residuals

GARCH Models in Python

Autocorrelation

  • Describe the correlation of a variable with itself given a time lag

  • Existence of autocorrelation in the standardized residuals indicates the model may not be sound

To detect autocorrelation:

  • ACF plot
  • Ljung-Box
GARCH Models in Python

ACF plot

  • ACF: AutoCorrelation Function
  • ACF Plot: visual representation of the autocorrelation by lags

ACF plot

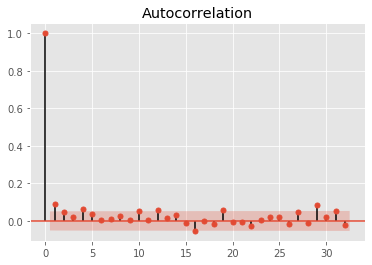
Red area in the plot indicates the confidence level (alpha = 5%)

GARCH Models in Python

ACF plot in Python

from statsmodels.graphics.tsaplots import plot_acf

plot_acf(my_data, alpha = 0.05)
GARCH Models in Python

Ljung-Box test

  • Test whether any of a group of autocorrelations of a time series are different from zero
  • H0: the data is independently distributed
  • P-value < 5%: the model is not sound
GARCH Models in Python

Ljung-Box test Python

# Import the Python module
from statsmodels.stats.diagnostic import acorr_ljungbox
# Perform the Ljung-Box test
lb_test = acorr_ljungbox(std_resid , lags = 10)
# Check p-values
print('P-values are: ', lb_test[1])
GARCH Models in Python

Let's practice!

GARCH Models in Python

Preparing Video For Download...