Mean imputation

Handling Missing Data with Imputations in R

Michal Oleszak

Machine Learning Engineer

Imputation vocabulary

Imputation = making an educated guess about what the missing values might be

  • Donor-based imputation - missing values are filled in using other, complete observations.
  • Model-based imputation - missing values are predicted with a statistical or machine learning model.

This chapter focuses on donor-based methods:

  • Mean imputation
  • Hot-deck imputation
  • kNN imputation
Handling Missing Data with Imputations in R

Mean imputation

A table with two columns: one with raw data, containing one missing value and another with imputed data, same as the former, but with the missing value mean-imputed.

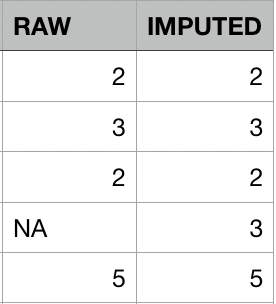
Mean imputation works well for time-series data that randomly fluctuate around a long-term average.

For cross-sectional data, mean imputation is often a very poor choice:

  • Destroys relations between variables.
  • There is no variance in the imputed values.
Handling Missing Data with Imputations in R

Mean imputation in practice

Task: mean-impute Height and Weight in NHANES data.

  • Create binary indicators for whether each value was originally missing.
nhanes <- nhanes %>% 
  mutate(Height_imp = ifelse(is.na(Height), TRUE, FALSE)) %>% 
  mutate(Weight_imp = ifelse(is.na(Weight), TRUE, FALSE))
  • Replace missing values in Height and Weight with their respective means.
nhanes_imp <- nhanes %>% 
  mutate(Height = ifelse(is.na(Height), mean(Height, na.rm = TRUE), Height)) %>% 
  mutate(Weight = ifelse(is.na(Weight), mean(Weight, na.rm = TRUE), Weight))
Handling Missing Data with Imputations in R

Mean-imputed NHANES data

nhanes_imp %>%
    select(Weight, Height, Height_imp, Weight_imp) %>%
    head()
     Weight   Height Height_imp Weight_imp
1  73.20000 166.2499       TRUE      FALSE
2  72.30000 166.2499       TRUE      FALSE
3  57.70000 158.9000      FALSE      FALSE
4  88.90000 183.3000      FALSE      FALSE
5  45.10000 157.6000      FALSE      FALSE
6  66.77065 158.4000      FALSE       TRUE
Handling Missing Data with Imputations in R

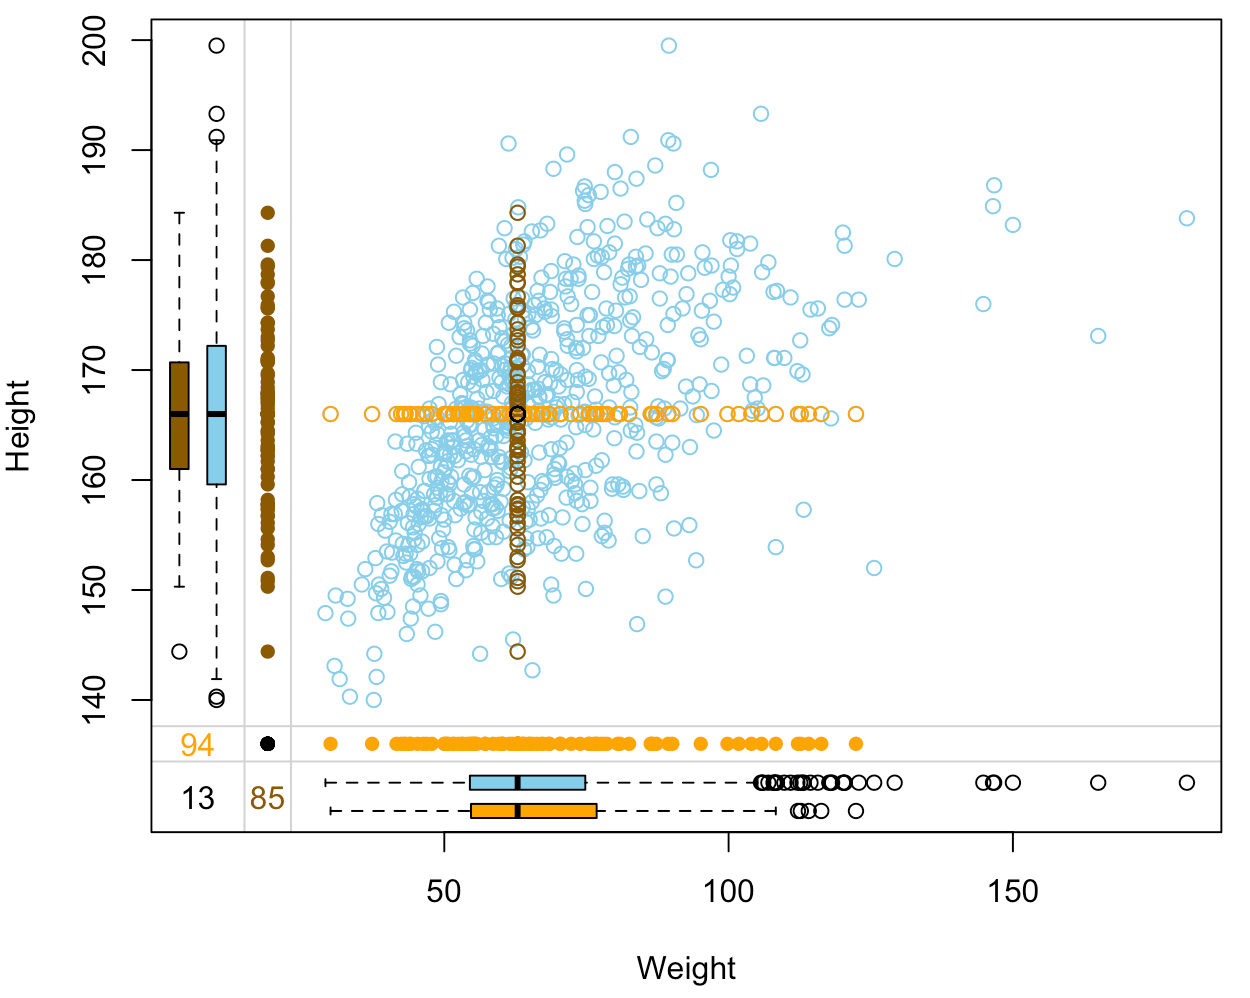
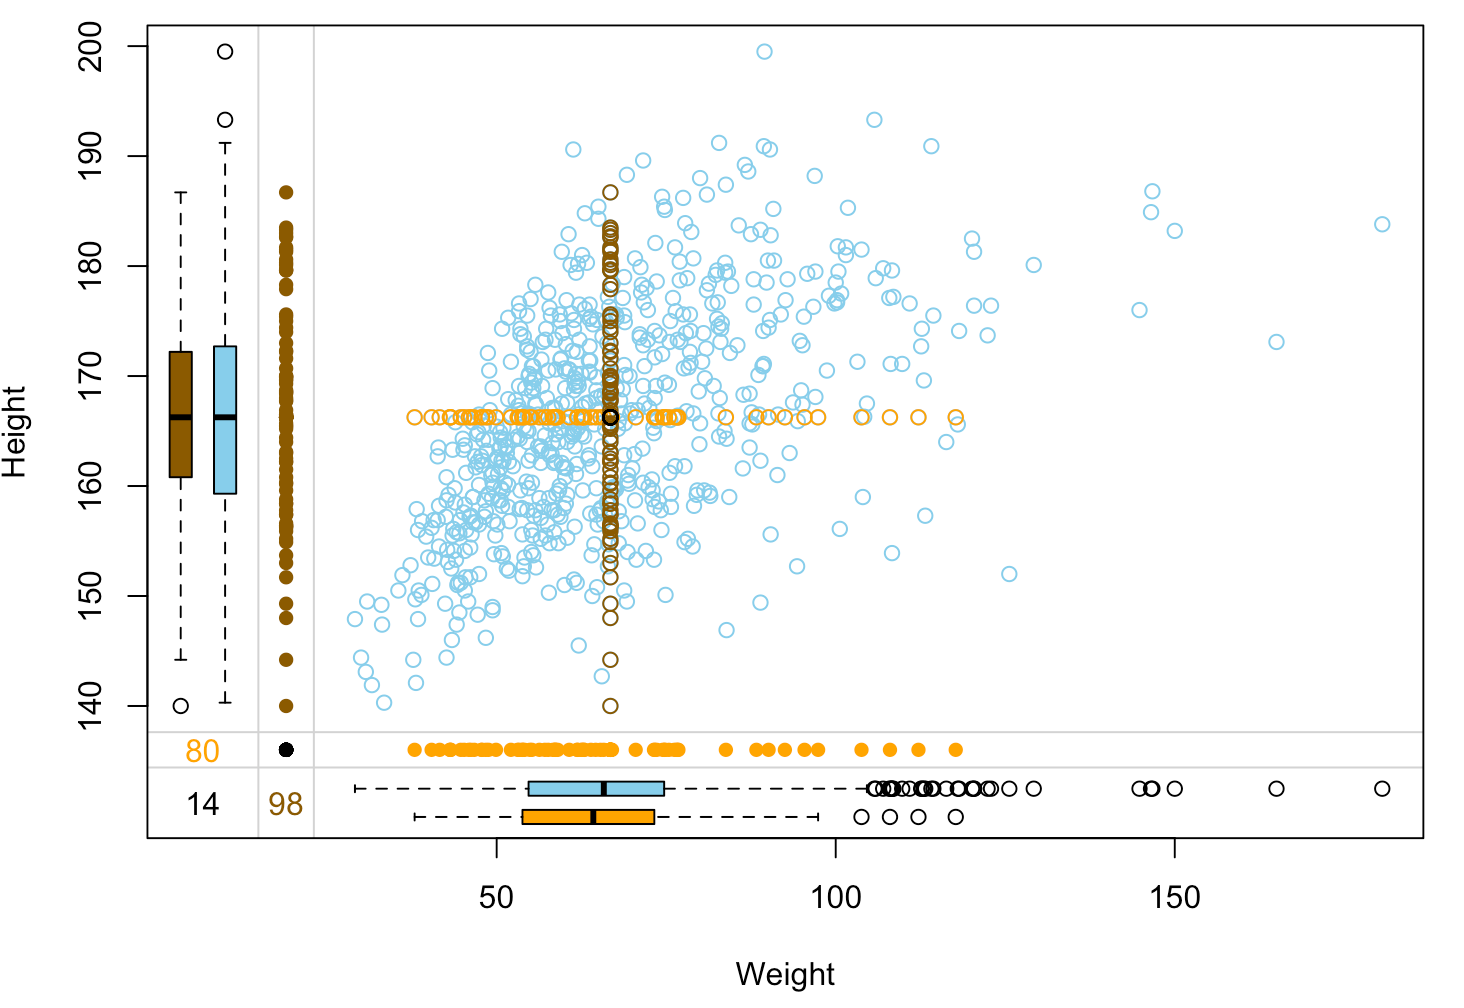
Assessing imputation quality: margin plot

nhanes_imp %>% select(Weight, Height, Height_imp, Weight_imp) %>% marginplot(delimiter="imp")

A margin plot, which is a scatter plot of "Height" vs "Weight", were values imputed in any of the two variables are highlighted in different color.

Handling Missing Data with Imputations in R

Troubles with mean imputation

Destroying relation between variables:

  • After mean-imputing Height and Weight, their positive correlation is weaker.
  • Models predicting one using the other will be fooled by the outlying imputed values and will produce biased results.

No variability in imputed data:

  • With less variance in the data, all standard errors will be underestimated. This prevents reliable hypothesis testing and calculating confidence intervals.
Handling Missing Data with Imputations in R

Median and mode imputation

  • Instead of the mean, one might impute with a median or a mode.
  • Median imputation is a better choice when there are outliers in the data.
  • For categorical variables, we cannot compute neither mean or median, so we use the mode instead.
  • Both median and mode imputation present the same drawbacks as mean imputation.

A margin plot, which is a scatter plot of "Height" vs "Weight", were values imputed in any of the two variables are highlighted in different color.

Handling Missing Data with Imputations in R

Let's practice!

Handling Missing Data with Imputations in R

Preparing Video For Download...