Visualizing missing data patterns

Handling Missing Data with Imputations in R

Michal Oleszak

Machine Learning Engineer
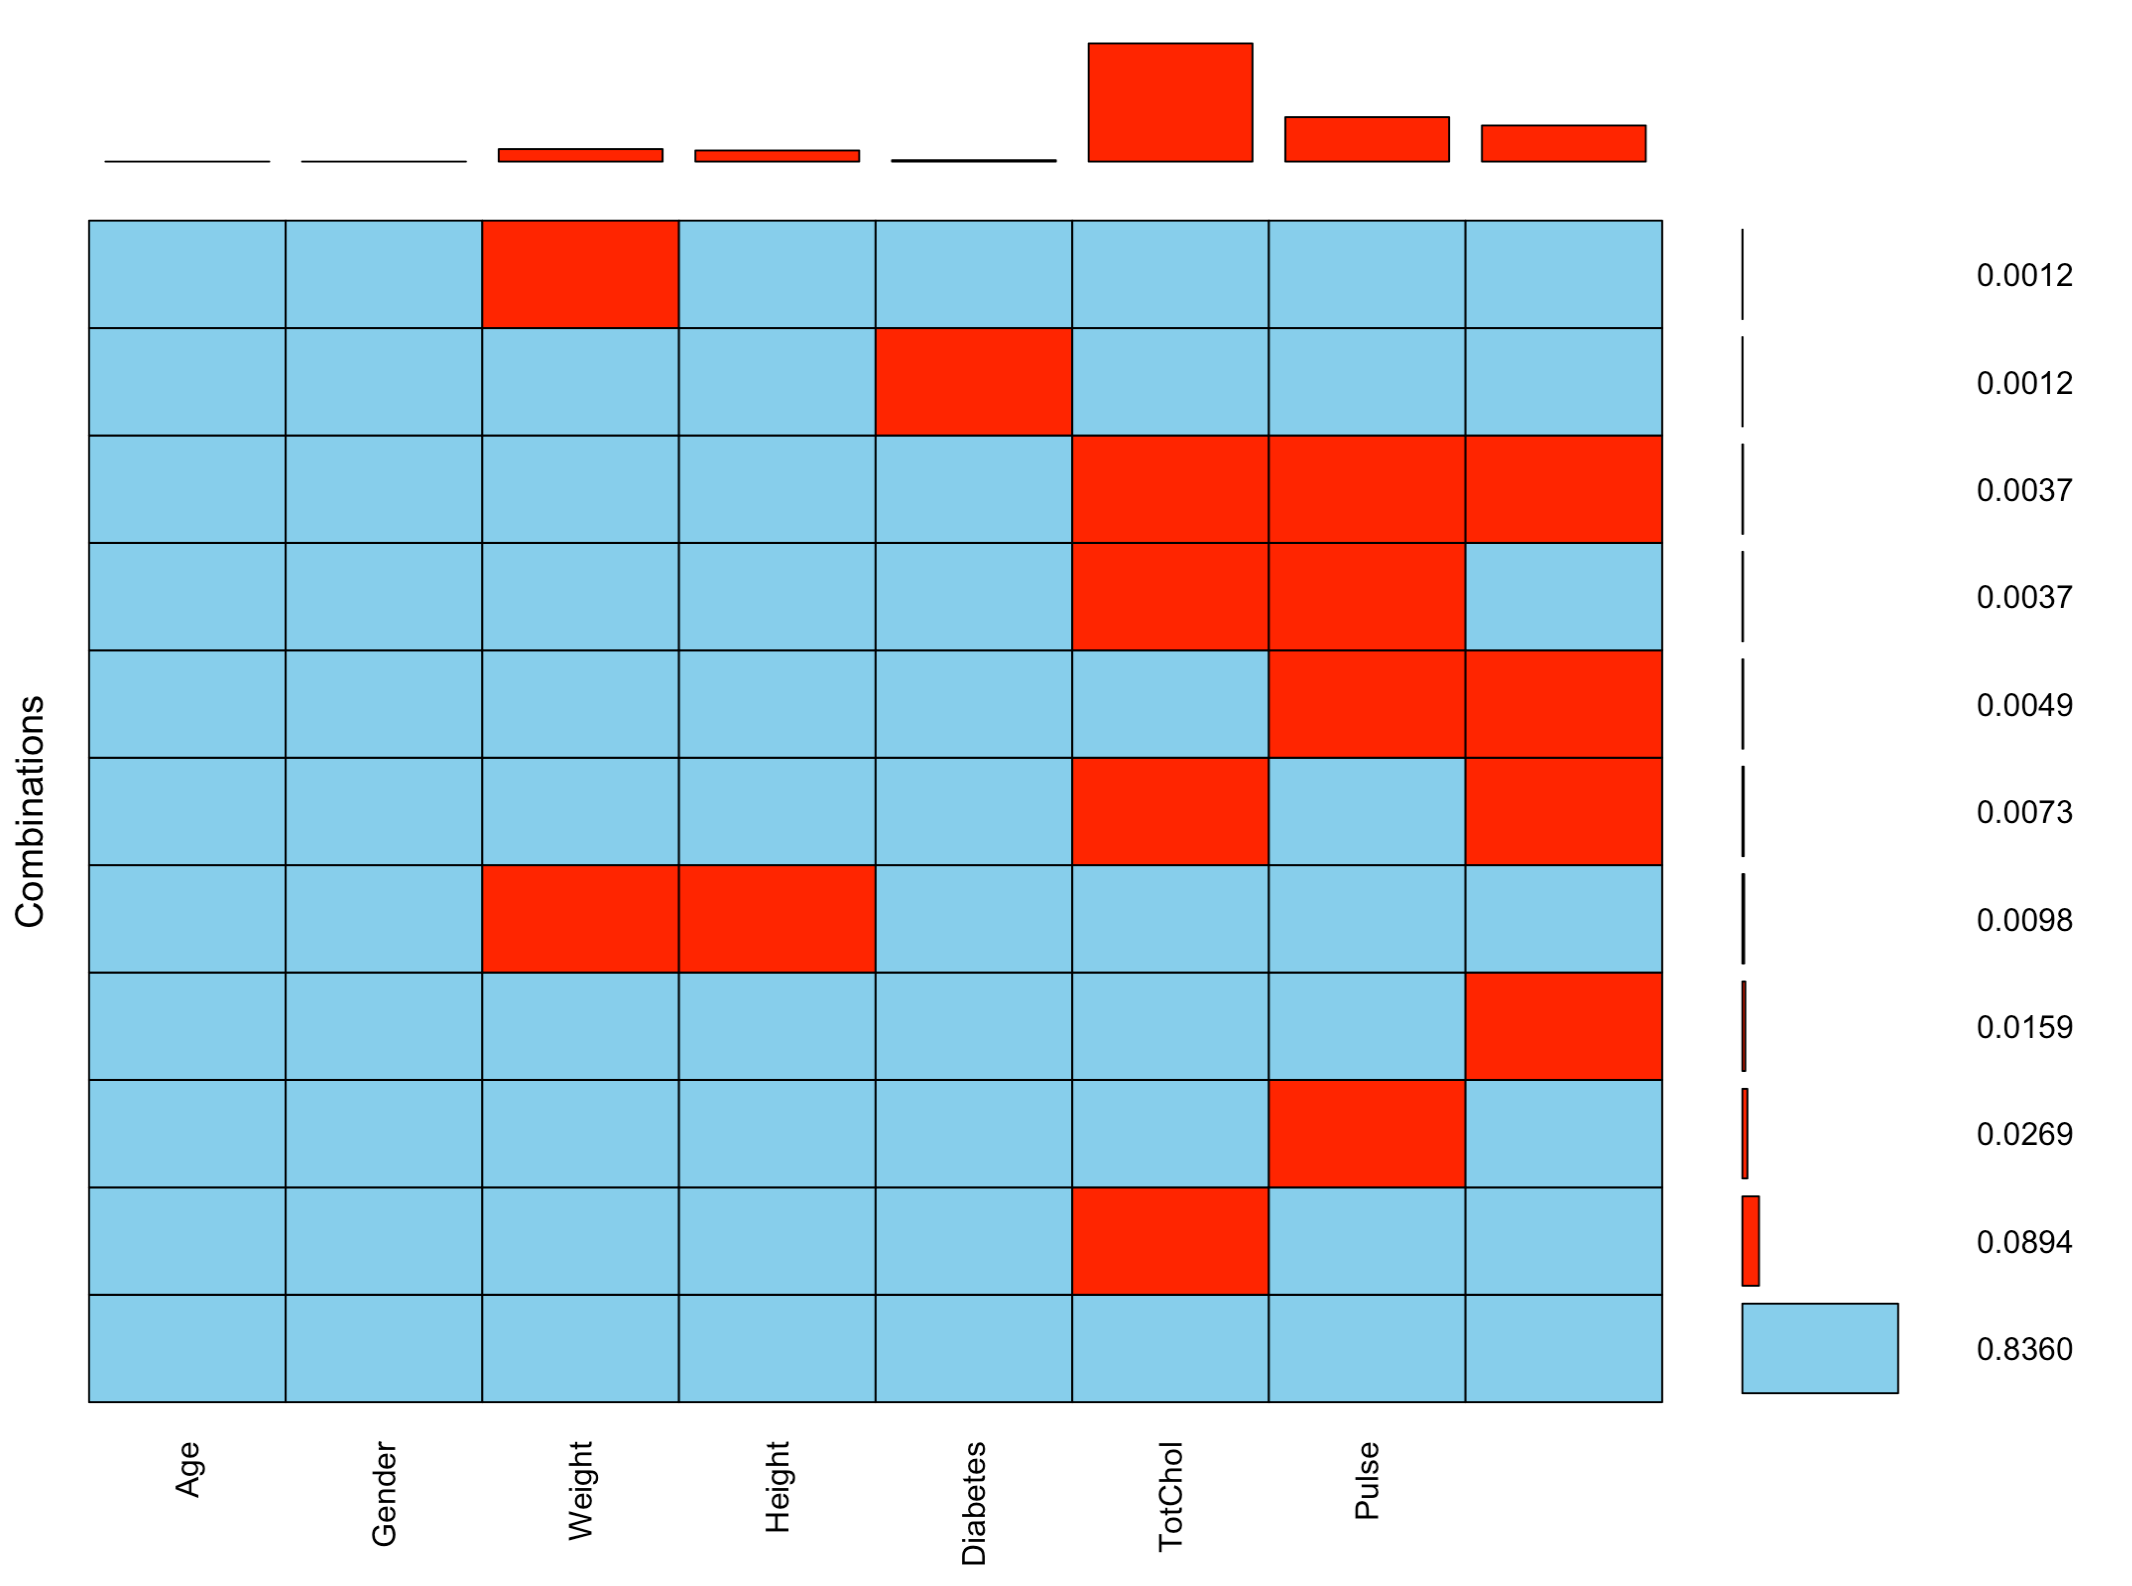
Problems with the testing approach

  • Detecting missing data patterns with statistical tests can be cumbersome.
  • t-test comes with many assumptions about the data.
  • Inferences based on p-values are prone to problems (choosing significance levels, p-hacking).
Handling Missing Data with Imputations in R

Visualizing missing data

  • Another approach: visualizations!
  • Easy to use.
  • Ability to detect missing data patterns.
  • Provide insights into other aspects of data quality.

The VIM package has a great set of tools for plotting missing data. In this lesson:

  • Aggregation plot
  • Spine plot
  • Mosaic plot
Handling Missing Data with Imputations in R

Aggregation plot

nhanes %>% aggr(combined = TRUE, numbers = TRUE)
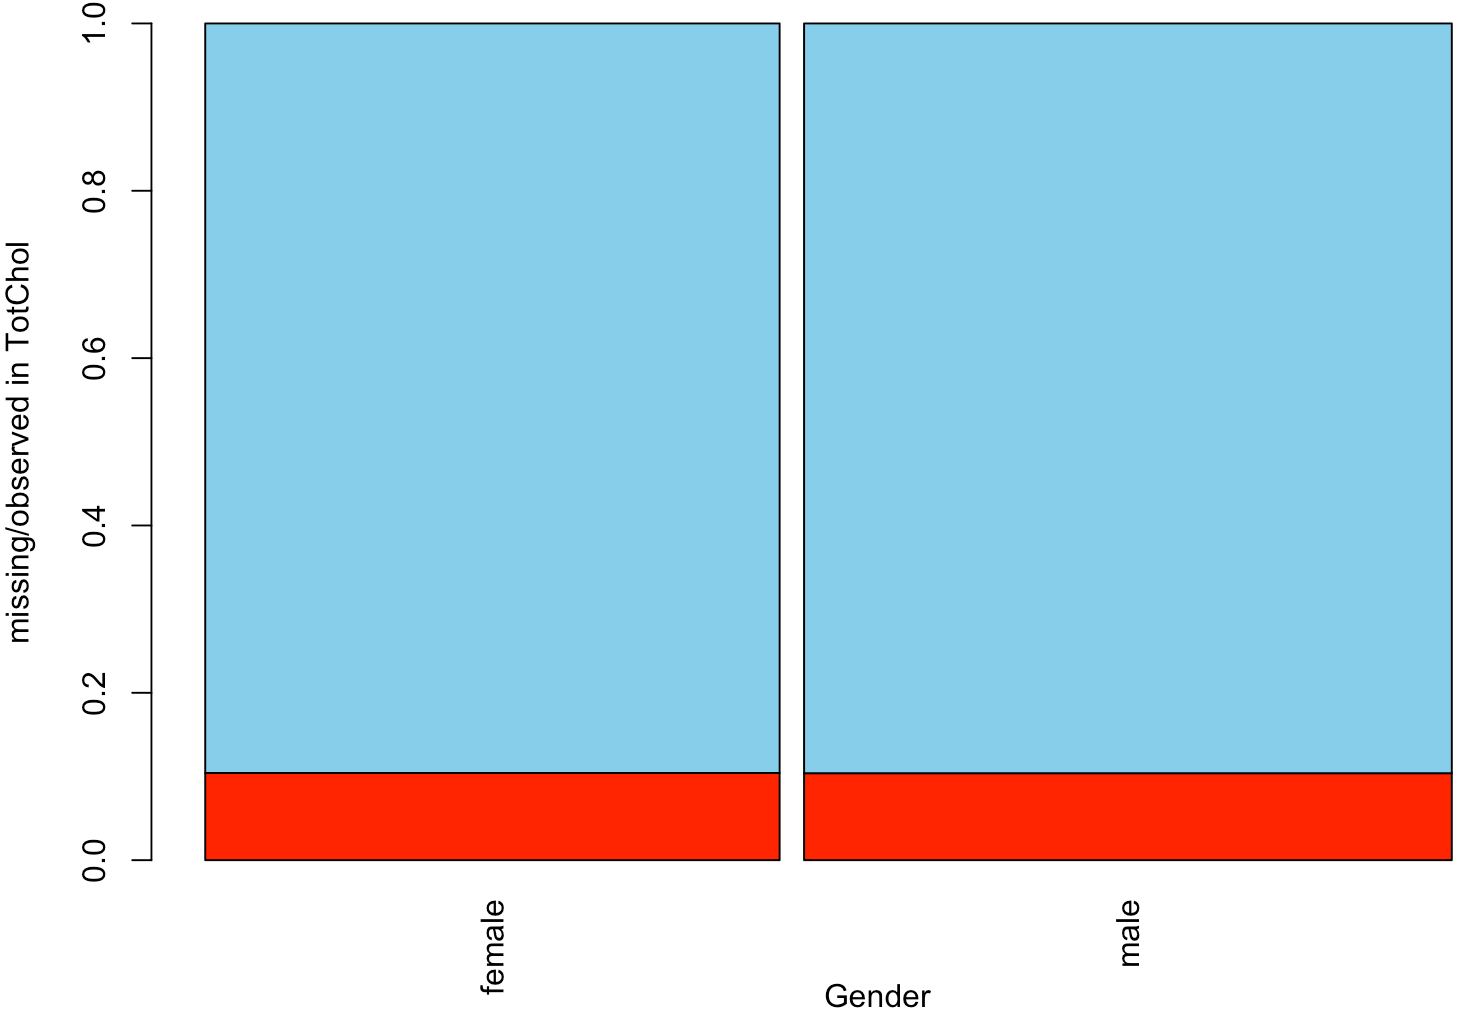
An aggregation plot that consists of a grid that presents all combinations of missing and observed values present in different variables of the biopics dataset. For each combination, it shows the percentage of observations with the corresponding missingness pattern.

Handling Missing Data with Imputations in R

Spine plot

nhanes %>% select(Gender, TotChol) %>% spineMiss()
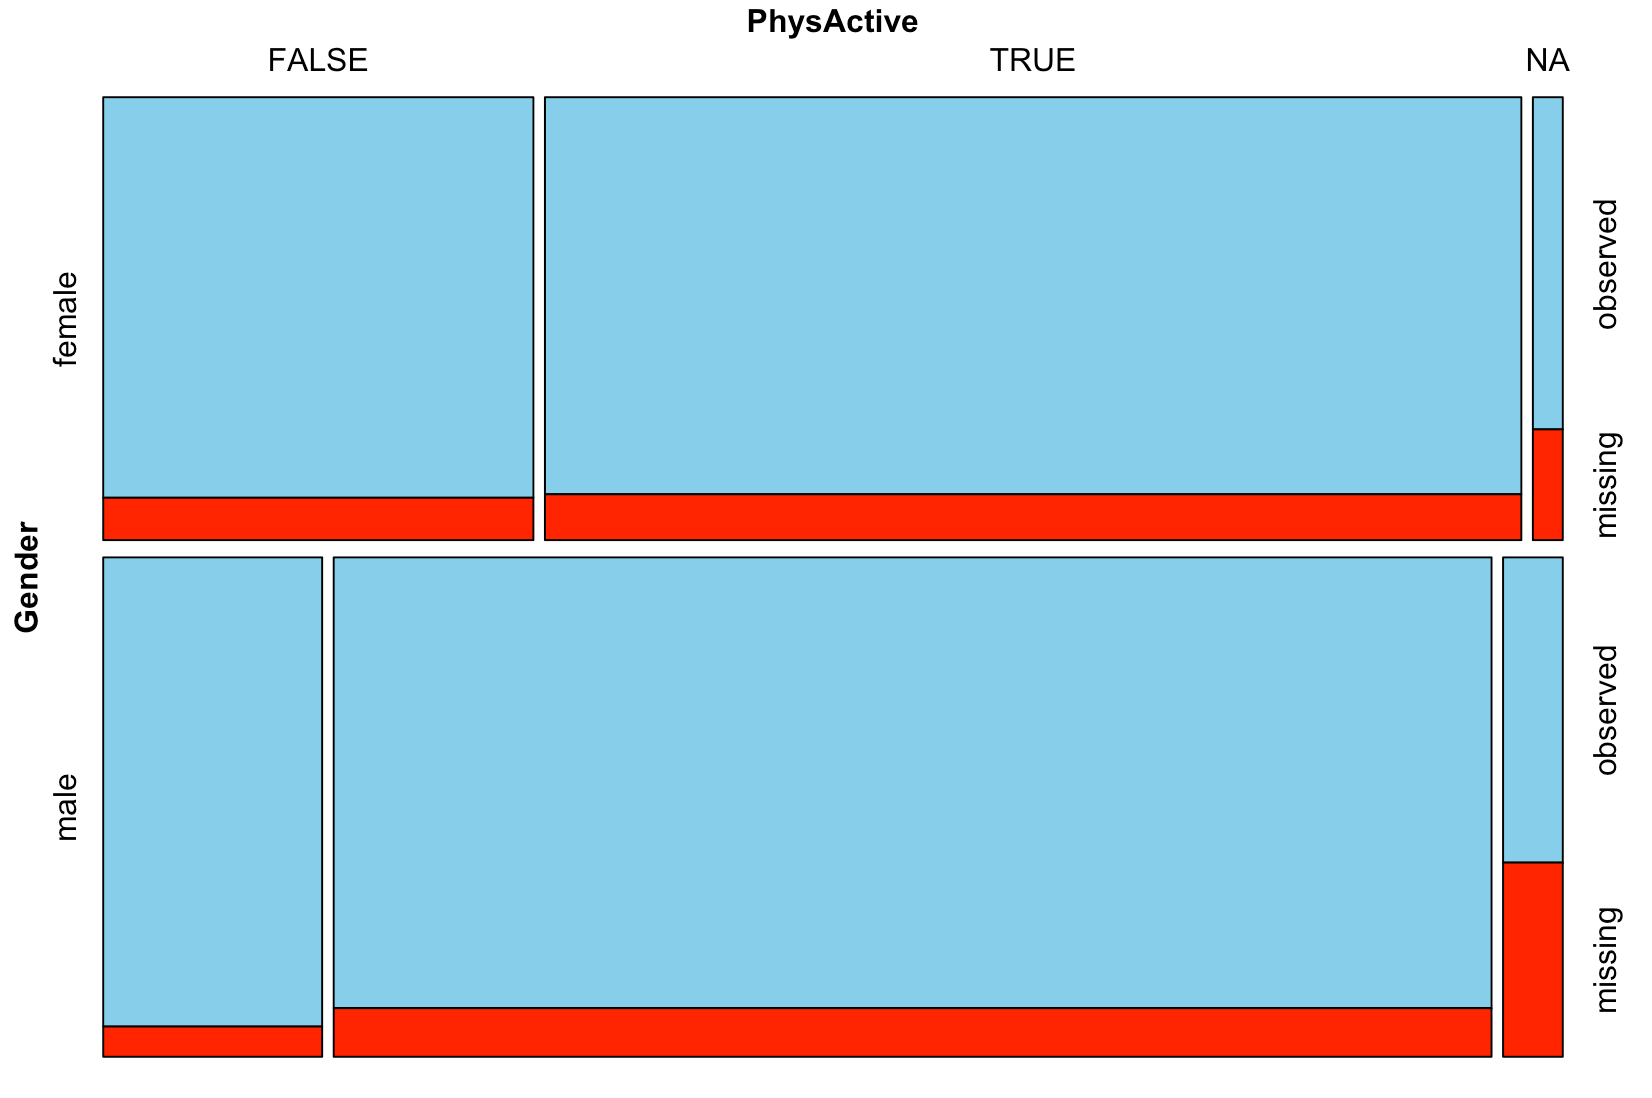
The spine plot consists of two bars corresponding to males and females. Inside each bar, the percentage of missing values in the total cholesterol variable for the corresponding gender is shown.

Handling Missing Data with Imputations in R

Mosaic plot

nhanes %>% mosaicMiss(highlight = "TotChol", plotvars = c("Gender", "PhysActive"))

A mosaic plot that consists of a collection of tiles forming a rectangle. Each tile corresponds to one of the values of "Gender" and one of the values of "PhysActive". Inside each tile, the percentage of missing values in the total cholesterol variable is shown.

Handling Missing Data with Imputations in R

Let's plot what's missing!

Handling Missing Data with Imputations in R

Preparing Video For Download...