Putting it all together
Handling Missing Data with Imputations in R

Michal Oleszak
Machine Learning Engineer
Case study: civil liberties in Africa
head(africa)
  year      country gdp_pc  infl trade    civlib population
1 1972 Burkina Faso    377 -2.92 29.69 0.5000000    5848380
2 1973 Burkina Faso    376  7.60 31.31 0.5000000    5958700
3 1974 Burkina Faso    393  8.72 35.22 0.3333333    6075700
4 1975 Burkina Faso    416 18.76 40.11 0.3333333    6202000
5 1976 Burkina Faso    435 -8.40 37.76 0.5000000    6341030
6 1977 Burkina Faso    448 29.99 41.11 0.6666667    6486870
1 Data source: https://scholar.harvard.edu/rbates/data
Modeling incomplete data
Goal: investigate the relation between the civil liberties, civlib, and GDP per capita, gdp_pc.
- Visualize incomplete data.
- Which variables are missing?
- What might be the missing data mechanisms?
- Impute missing data and inspect imputation quality.
- Run a model on imputed data, accounting for imputation uncertainty.
What you will need
aggr()spineMiss()mice()-with()-pool()
Assessing imputation quality with MICE
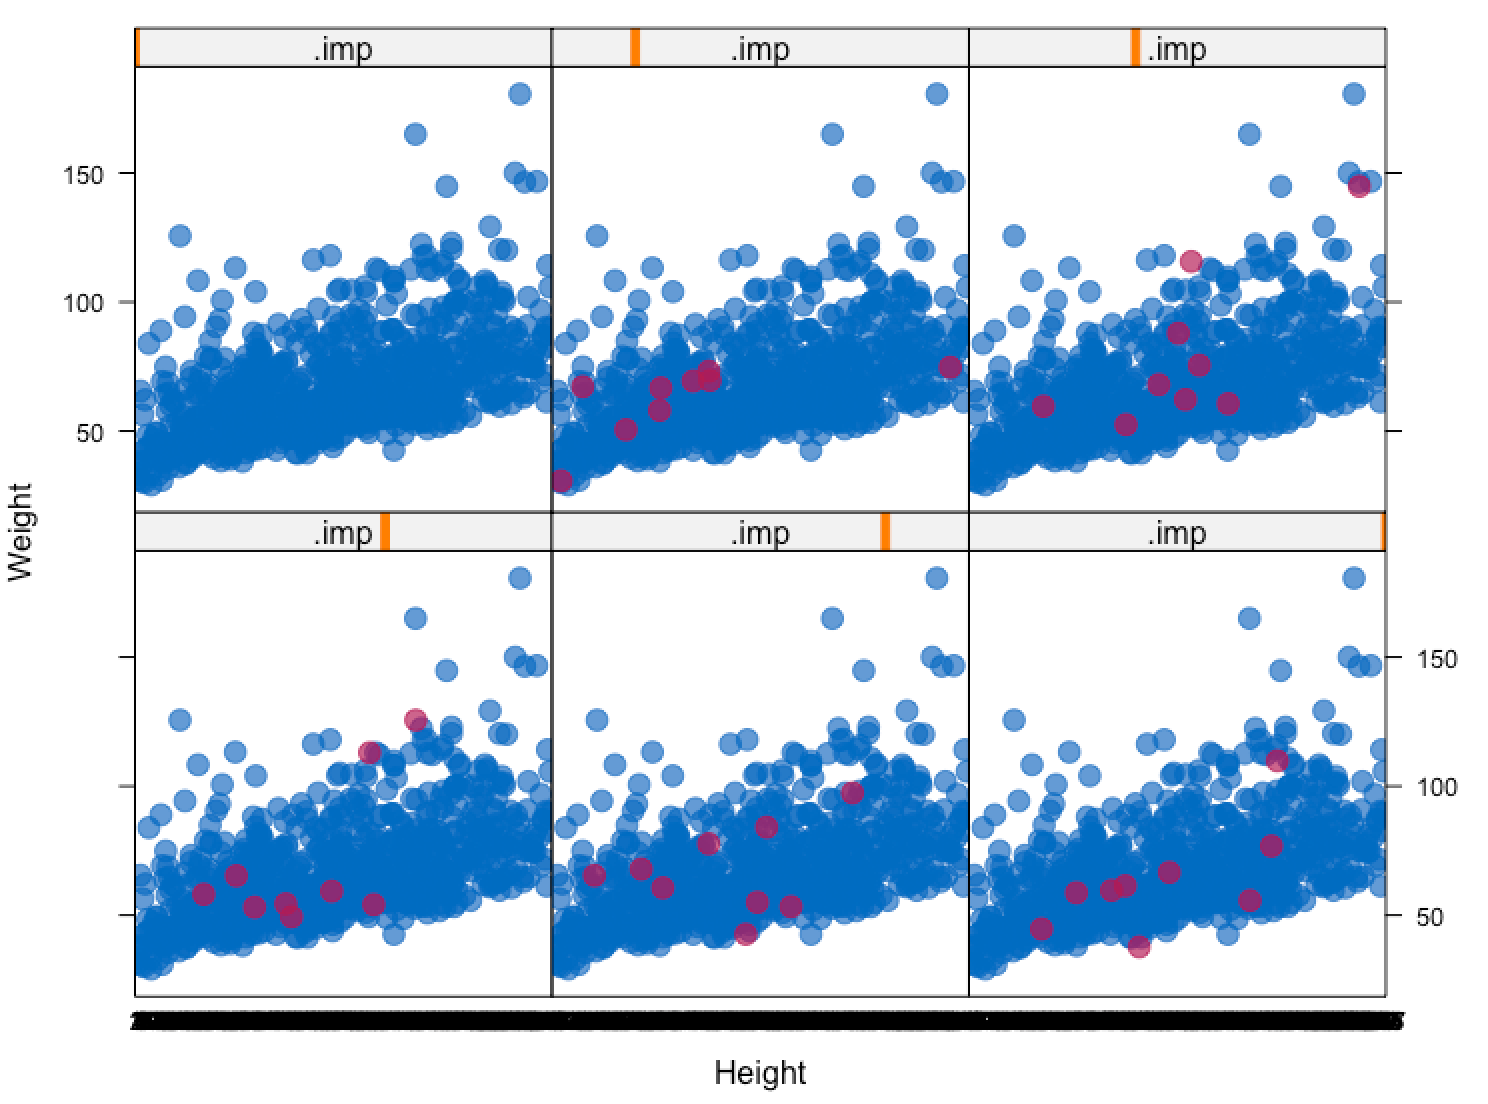
mice()produces multiple imputed data sets.- Visualizing each of them with
VIM's functions could be cumbersome. - The
micepackage offers its own plots that automatically handle multiple data sets.
nhanes_multiimp <- mice(nhanes, m = 5, defaultMethod = "pmm")
stripplot(nhanes_multiimp,
          Weight ~ Height | .imp,
          pch = 20, cex = 2)
Strip plot

Let's put what you've learned to practice!
Handling Missing Data with Imputations in R

