k-Nearest-Neighbors imputation
Handling Missing Data with Imputations in R

Michal Oleszak
Machine Learning Engineer
k-Nearest-Neighbors imputation
k-Nearest-Neighbors imputation
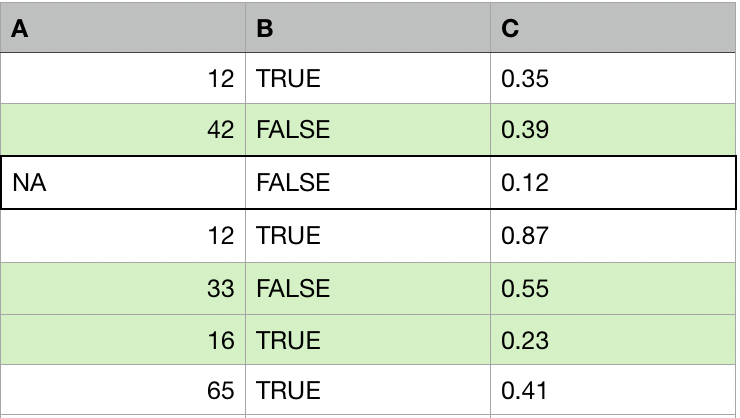
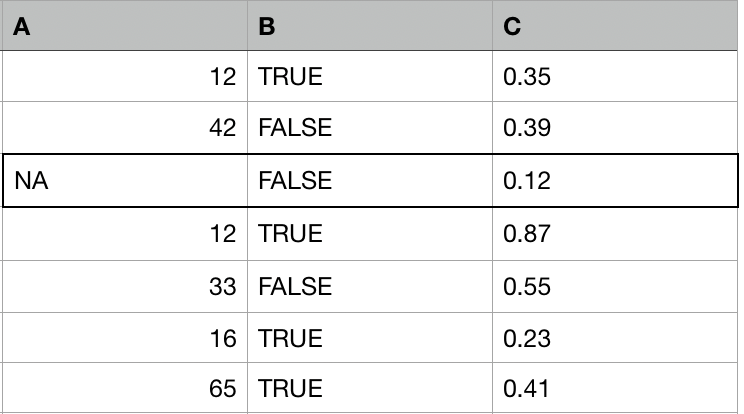
For each observation with missing values:
- Find other k observations (donors, neighbors) that are most similar to that observation.
k-Nearest-Neighbors imputation
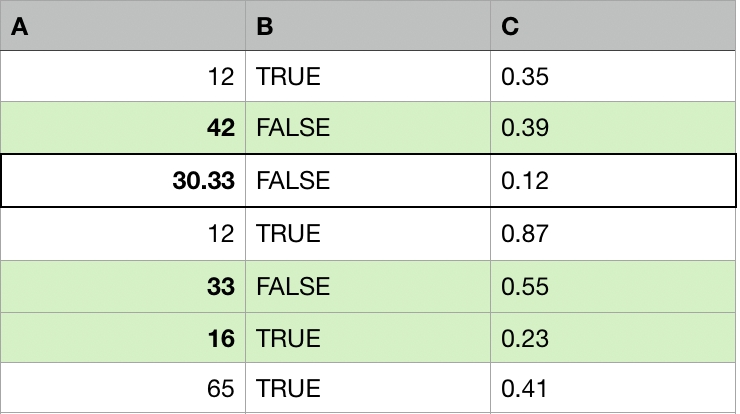
For each observation with missing values:
- Find other k observations (donors, neighbors) that are most similar to that observation.
- Replace the missing values with aggregated values from the k donors (mean, median, mode).
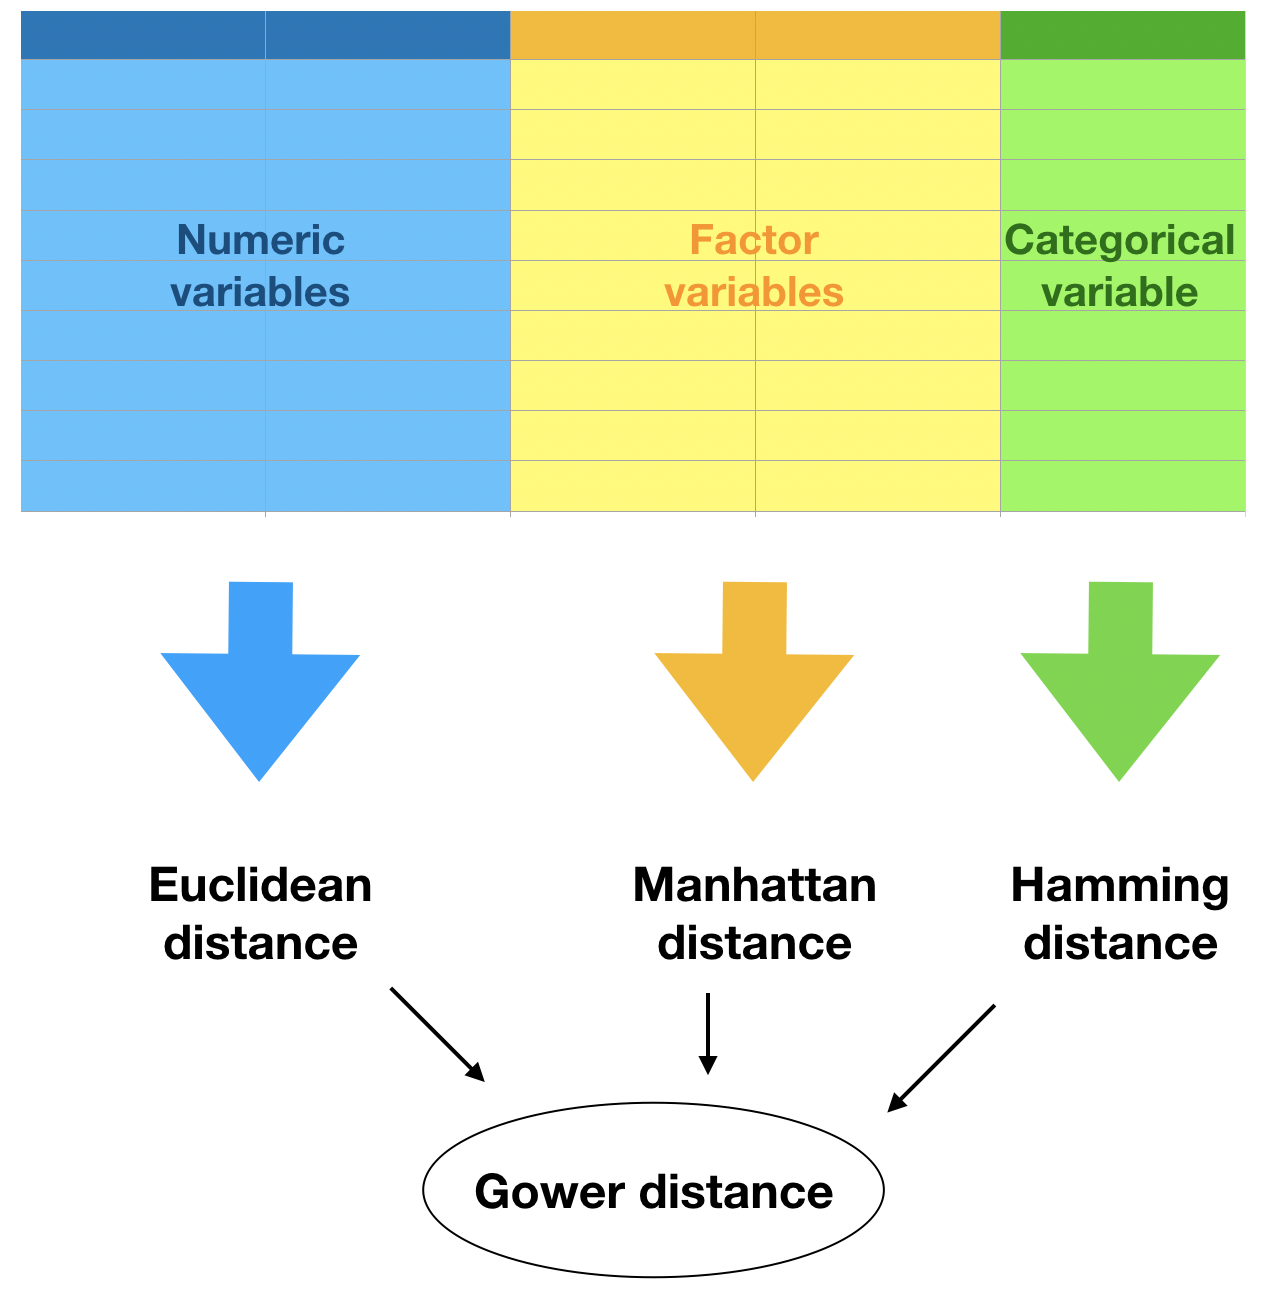
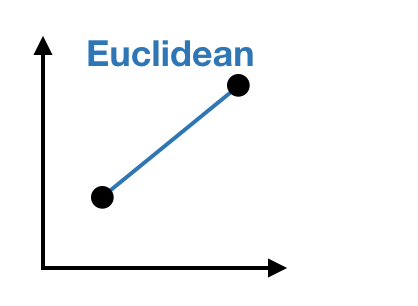
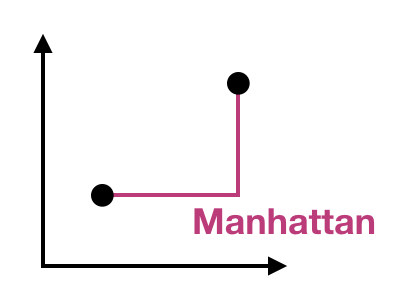
Distance measures
Gower distance
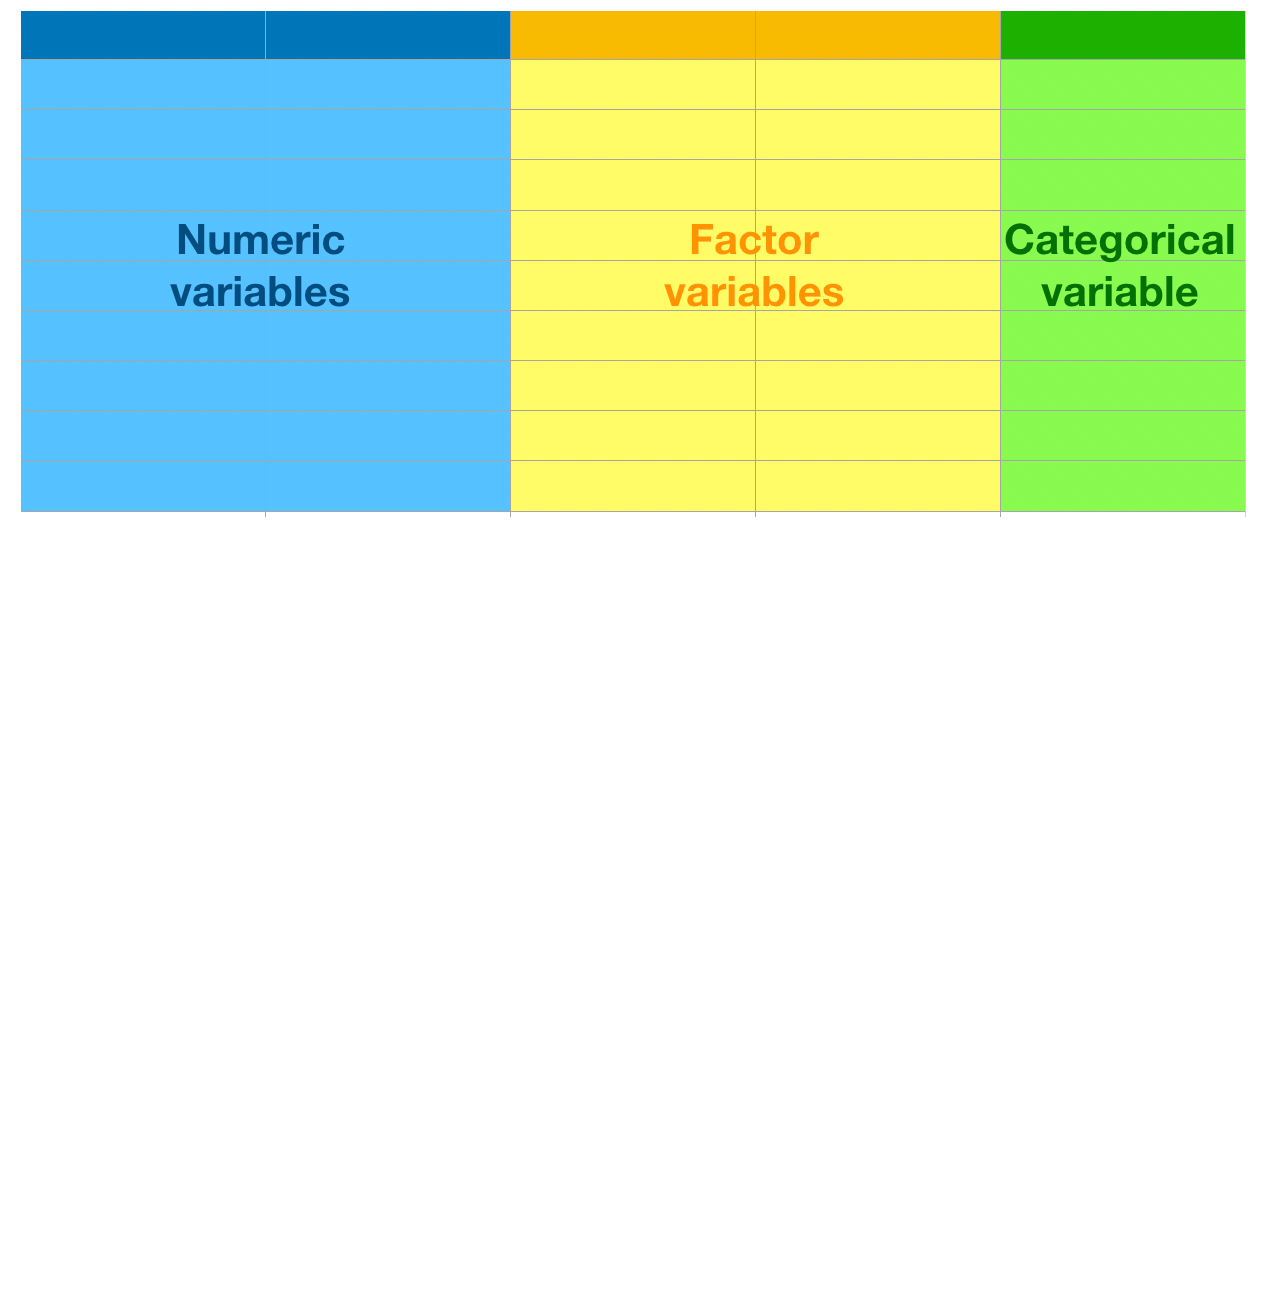
Gower distance