Refresher on xts and the plot() function
Visualizing Time Series Data in R

Arnaud Amsellem
Quantitative Trader and creator of the R Trader blog
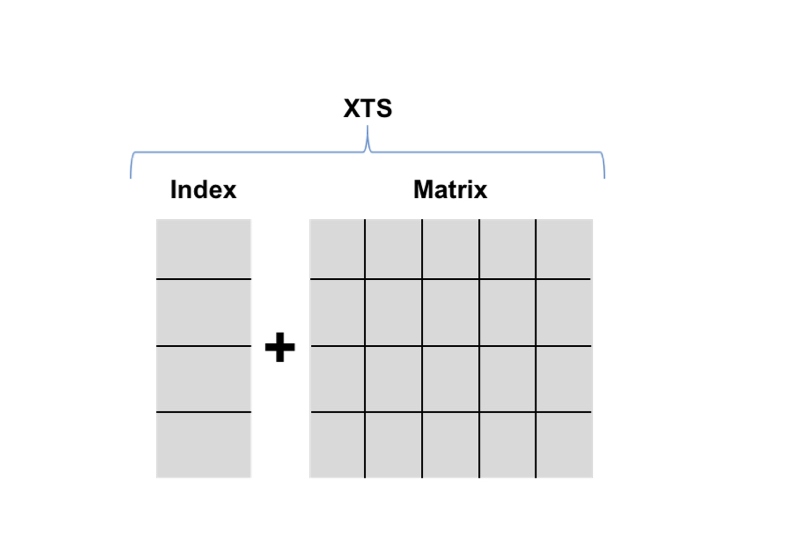
Refresher on xts
- A special class of object to handle time series
- eXtensible Time Series
- xts = Time Index + Matrix
- The index is a time object:
Date,POSIX Time,timeDate,chron
Using the plot() function
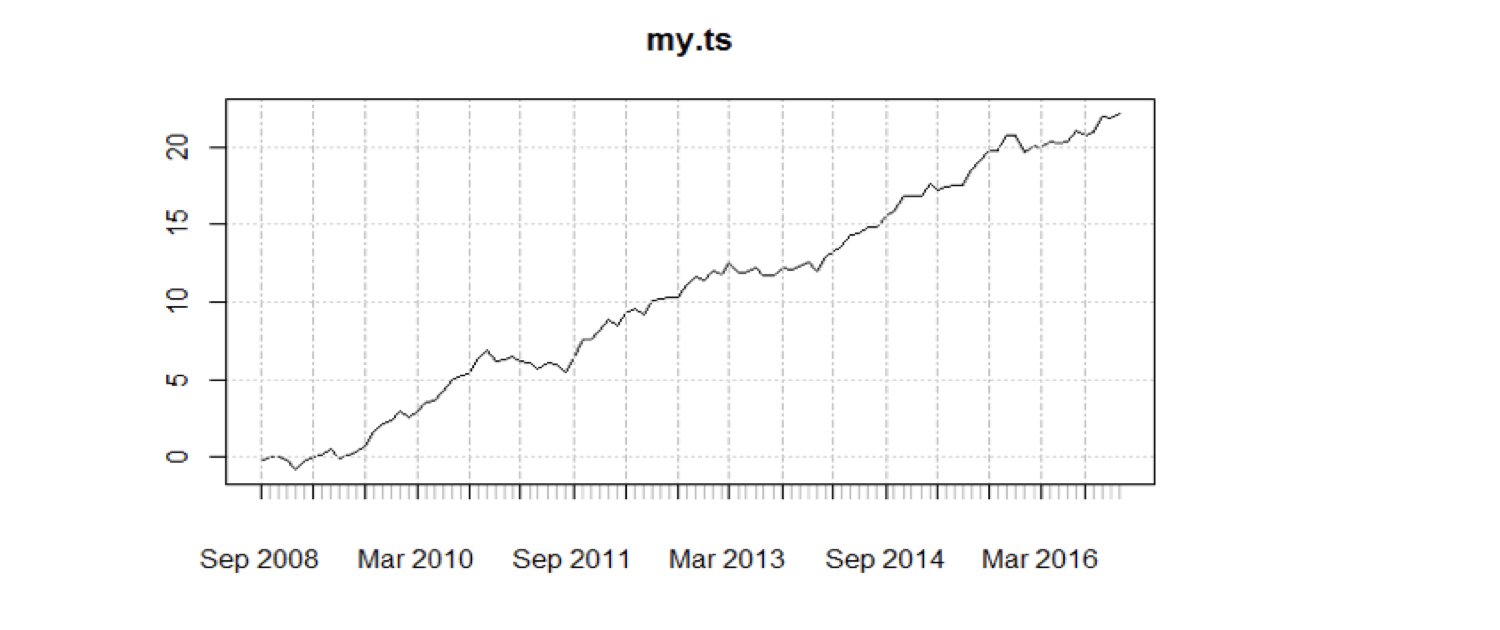
plot(my_ts)
Using the plot() function
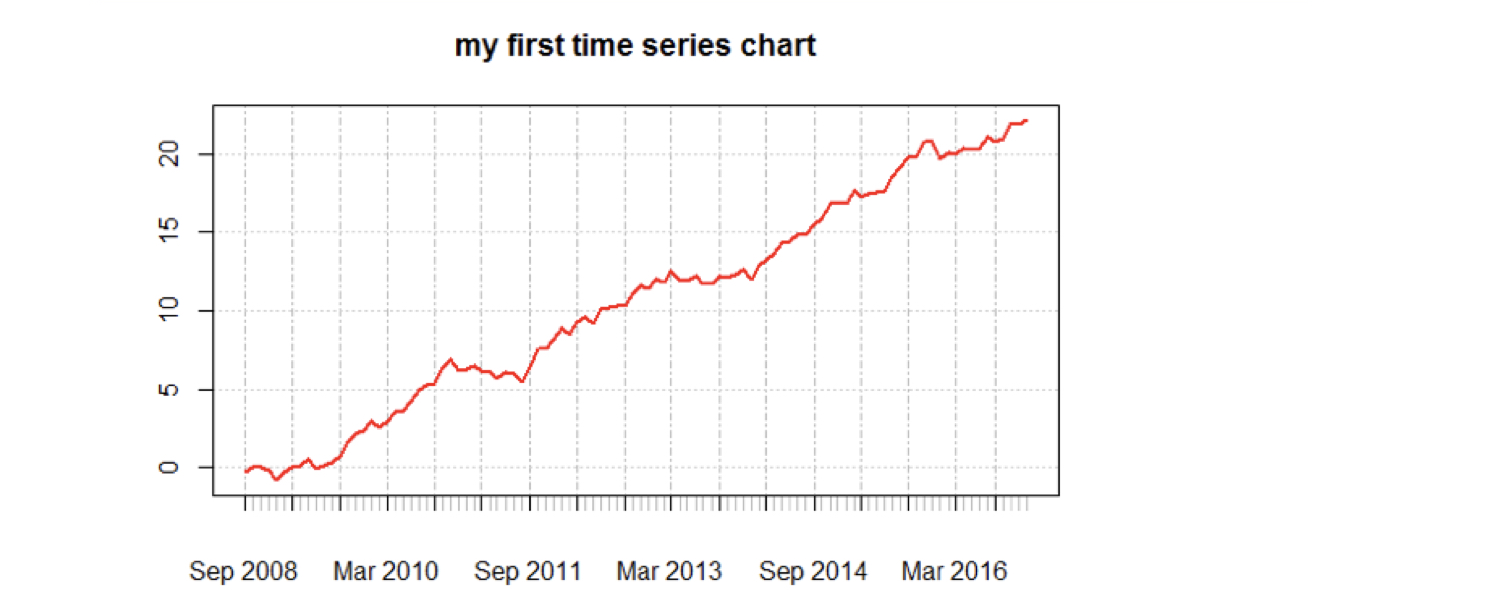
plot(my_ts, main = "my first time series")
lines(my_ts, col = "red", lwd = 2)
Using the plot() function
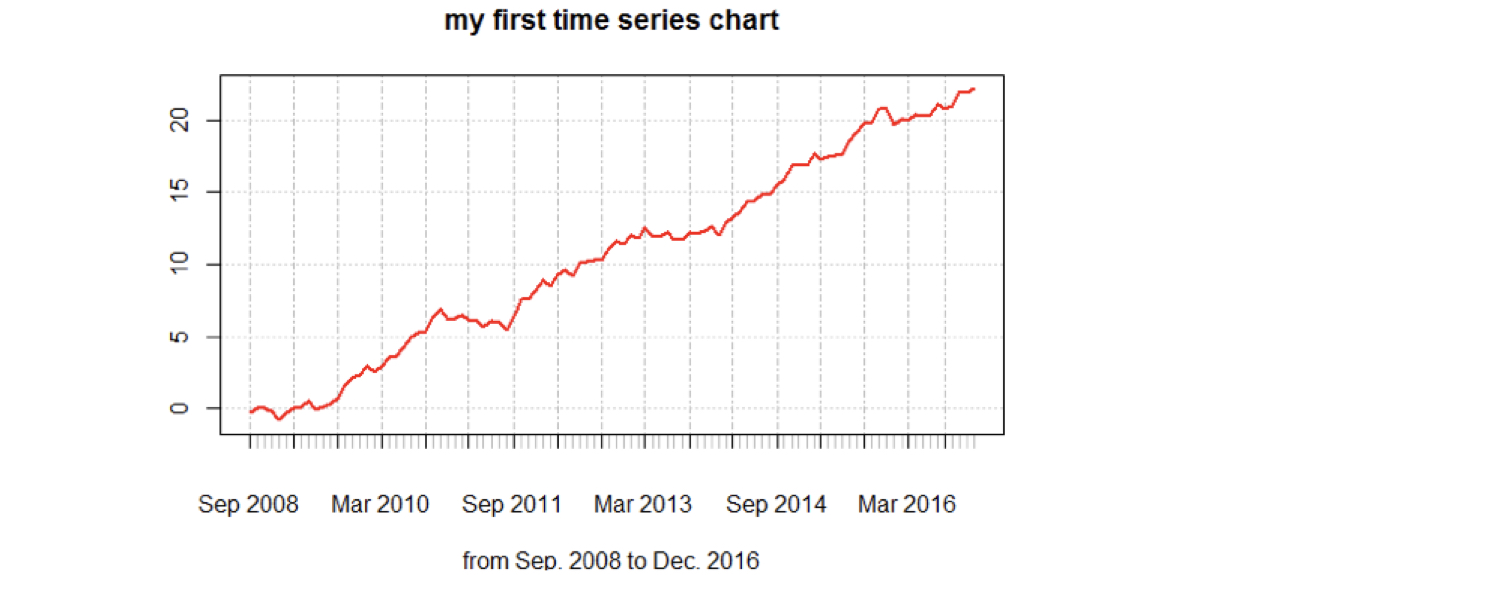
plot(my_ts, main = "my first time series",
            sub = "from Sep. 2008 to Dec. 2016")
lines(my_ts, col = "red", lwd = 2)

