New stocks
Visualizing Time Series Data in R

Arnaud Amsellem
Quantitative Trader and creator of the R Trader blog
Conclusions so far
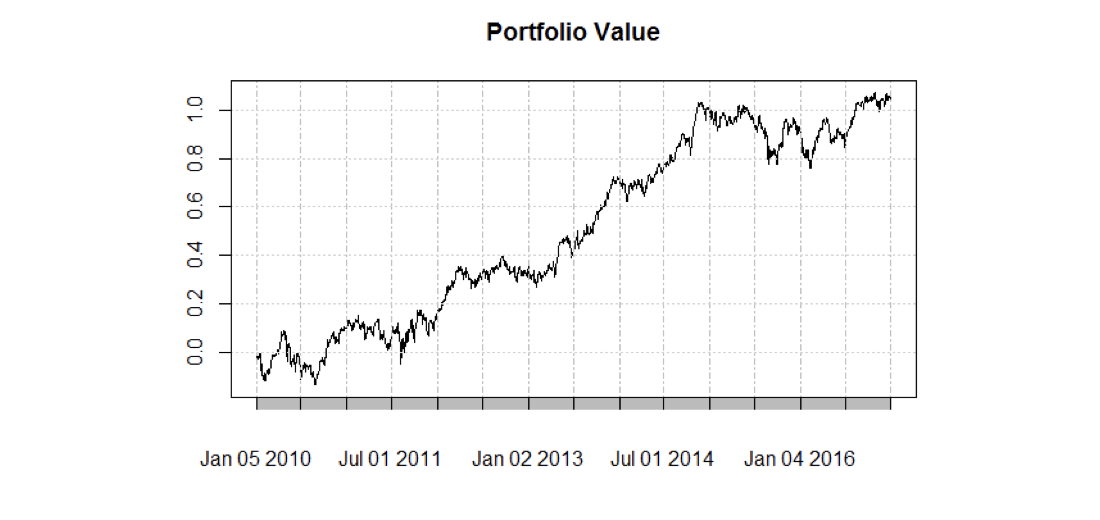
- The value increased by 100% over the course of 7 years
Conclusions so far
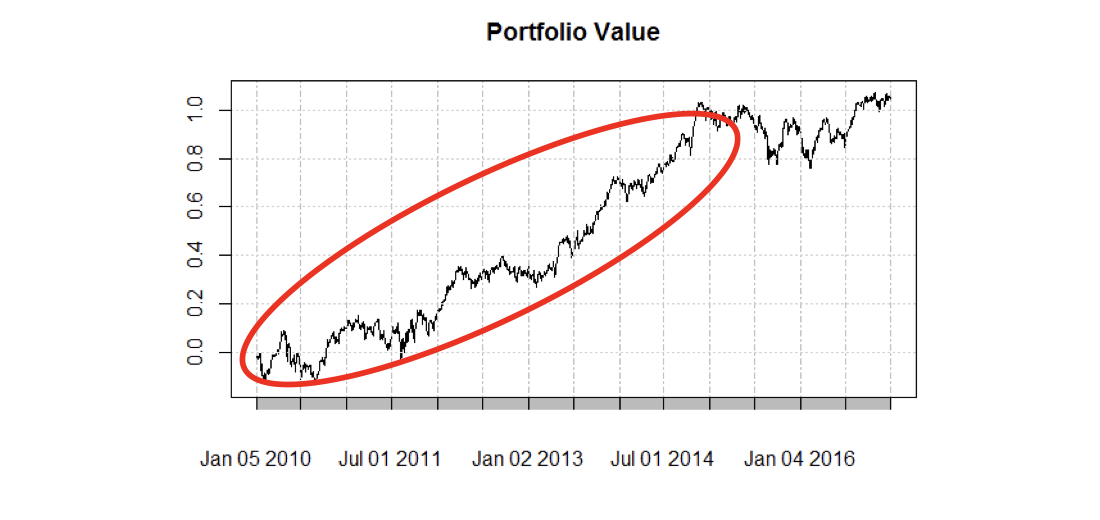
- The value increased by 100% over the course of 7 years
- Really good performance between 2010 and 2014
Conclusions so far
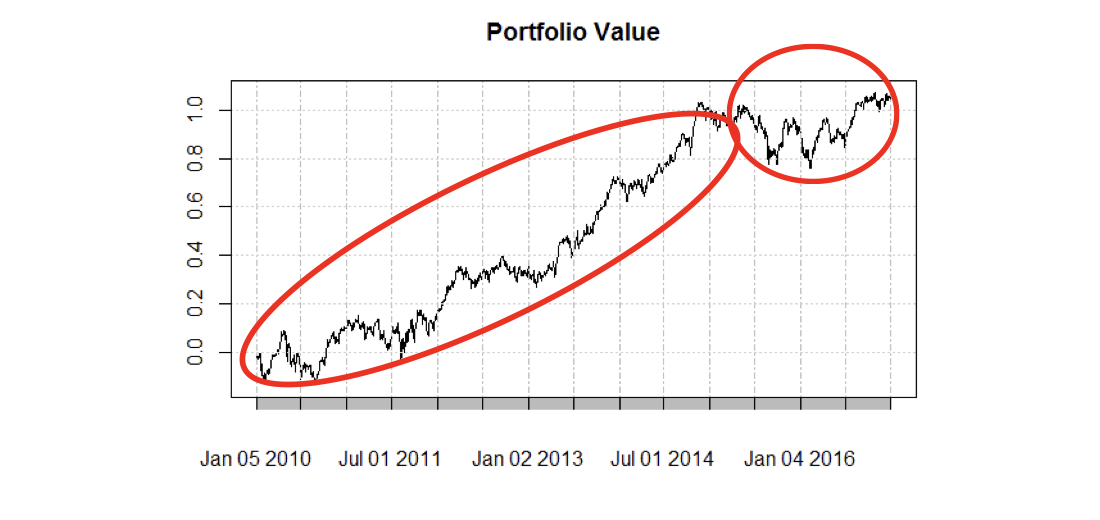
- The value increased by 100% over the course of 7 years
- Really good performance between 2010 and 2014
- No performance since end of 2014

