Binomial experiments
Life Insurance Products Valuation in R

Roel Verbelen, Ph.D.
Statistician, Finity Consulting
The life table in R
life_tablecontains the period life table for males in Belgium of 2013.
head(life_table, 10)
   age      qx     lx  dx    ex
1    0 0.00381 100000 381 77.95
2    1 0.00047  99619  47 77.24
3    2 0.00019  99572  19 76.28
4    3 0.00015  99553  15 75.30
5    4 0.00013  99538  13 74.31
6    5 0.00010  99525  10 73.32
7    6 0.00011  99514  11 72.32
8    7 0.00008  99504   8 71.33
9    8 0.00011  99496  11 70.34
10   9 0.00008  99485   8 69.34
# Variables used in this video
qx <- life_table$qx
px <- 1 - qx
lx <- life_table$lx
dx <- life_table$dx
A binomial experiment: surviving one year
- Focus on $\ell_x$ in
life_table.
lx[0 + 1]
1e+05
A binomial experiment: surviving one year
- The number of survivors up to age $x+1$ follows a BIN($\ell_x$,$\ p_{x}$).
lx[72 + 1]
73977
px[72 + 1]
0.97369
rbinom(n = 1, size = lx[72 + 1], prob = px[72 + 1])
72022
A binomial experiment: surviving one year
- Now in a vectorized way!
sims <- rbinom(n = length(lx), size = lx, prob = px)
head(sims)
99637 99567 99553 99546 99525 99515
A binomial experiment: surviving $k$ years
The number of 1-year survivors follows a BIN($\ell_x$,$\ p_{x}$).
$\quad \,$ Expected value:
$$ \ell_{x+1} = \ell_x \cdot p_x. $$The number of $k$-year survivors follows a BIN($\ell_x$,$\ _{k}p_{x}$).
$\quad \,$ Expected value:
$$ \ell_{x+k} = \ell_{x} \cdot \ _{k}p_{x}. $$
$\quad \,$ Thus:
$$ _{k}p_{x} = \frac{\ell_{x+k}}{\ell_{x}}. $$
A binomial experiment: the number of deaths
- The number of deaths follows a BIN($\ell_x$,$\ q_{x}$).
$\quad \,$ Expected value: $$ \large \begin{aligned} d_x &= \ell_x \cdot q_x \\ &= \ell_x \cdot (1-p_x) \\ &= \ell_x -\ell_{x+1}. \end{aligned} $$
dx[72 + 1]
1946
lx[72 + 1] - lx[73 + 1]
1946
Survival probabilities in R
Compute $_5p_{65} = \dfrac{\ell_{70}}{\ell_{65}}$.
# Probability that (65) survives 5 more years
lx[age == 70] / lx[age == 65]
0.9143957
# Alternatively
lx[70 + 1] / lx[65 + 1]
0.9143957
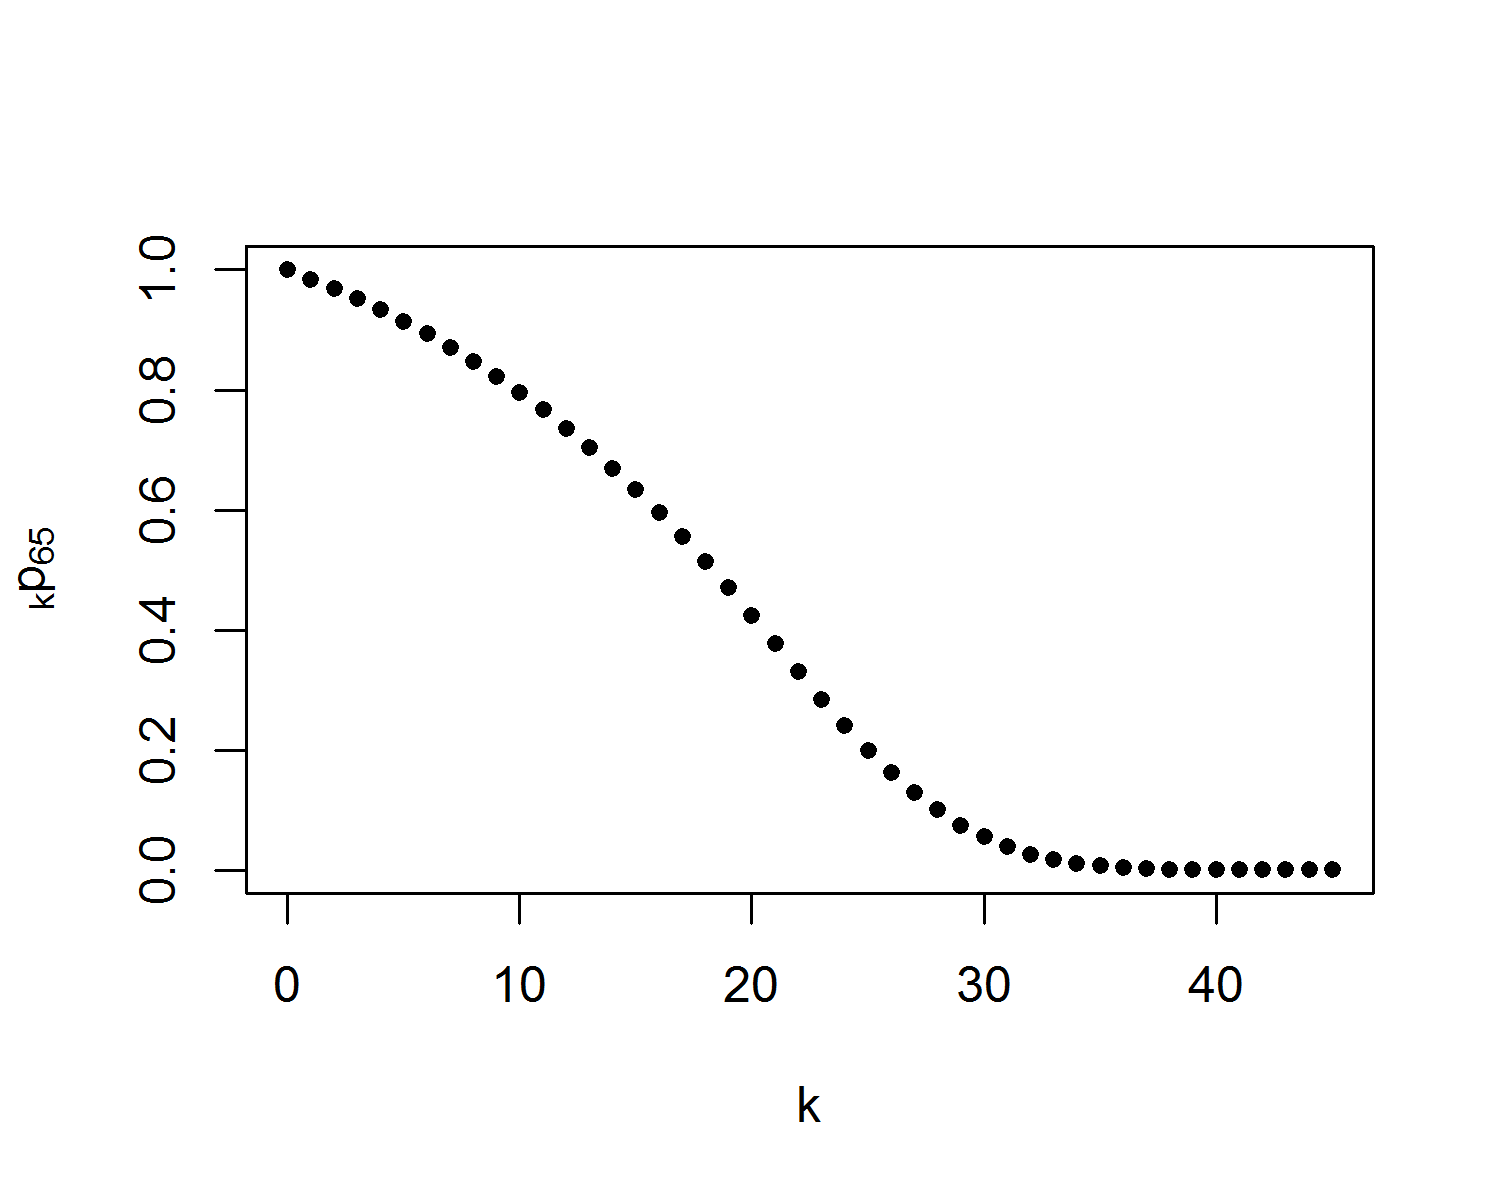
Picturing survival probabilities in R
# probability that (65) survives to age 65 + k
k <- 0:45
plot(k,
     lx[65 + k + 1] / lx[65 + 1],
     pch = 20,
     xlab = "k",
     ylab = expression(paste(""[k], "p"[65])))

Let's practice!
Life Insurance Products Valuation in R

