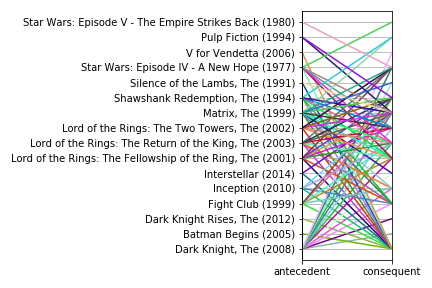
Parallel coordinates plot
Market Basket Analysis in Python

Isaiah Hull
Visiting Associate Professor of Finance, BI Norwegian Business School
What is a parallel coordinates plot?
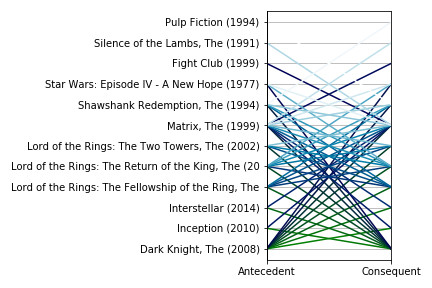
Generating a parallel coordinates plot
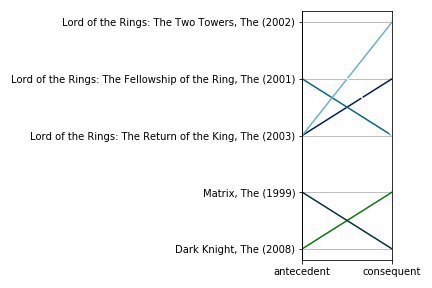
Refining a parallel coordinates plot