Scatterplots
Market Basket Analysis in Python

Isaiah Hull
Visiting Associate Professor of Finance, BI Norwegian Business School
Introduction to scatterplots

Introduction to scatterplots
- A scatterplot displays pairs of values.
- Antecedent and consequent support.
- Confidence and lift.
- No model is assumed.
- No trend line or curve needed.
- Can provide starting point for pruning.
- Identify patterns in data and rules.
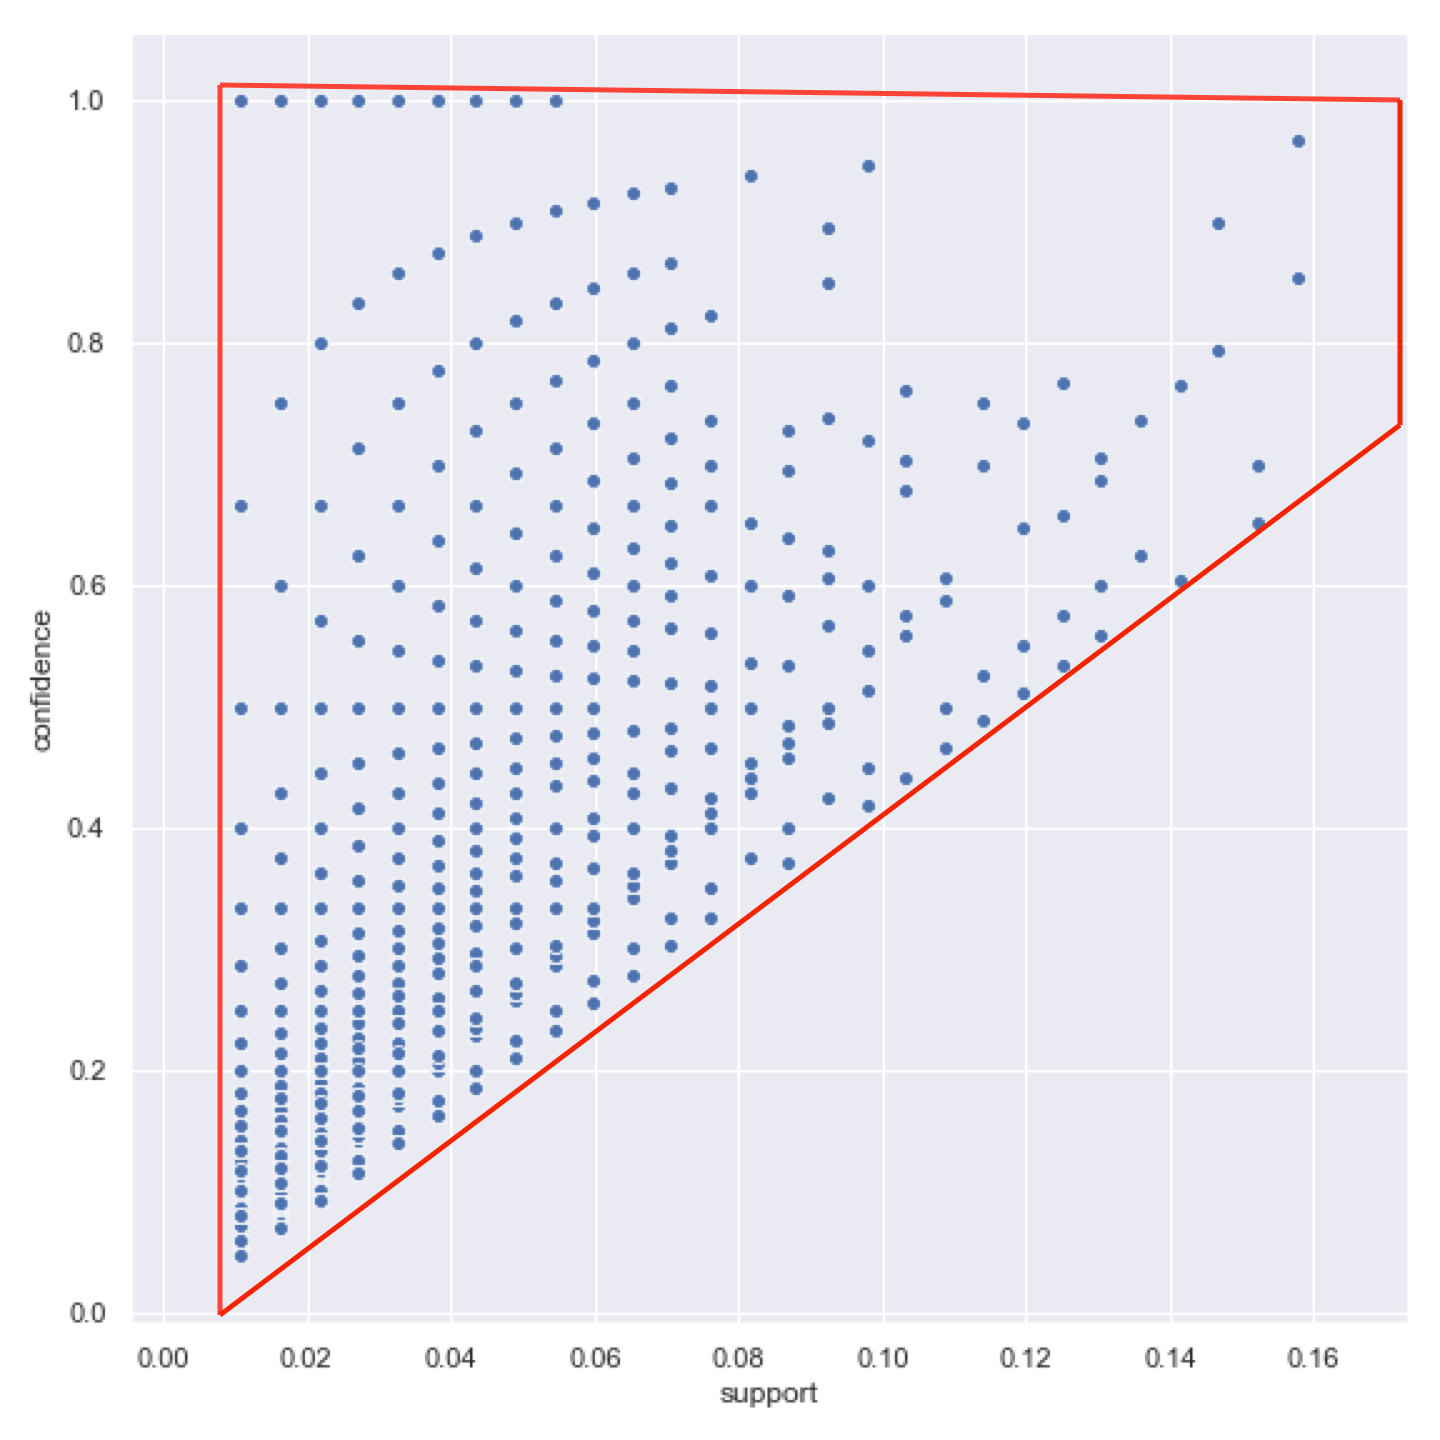
Support versus confidence

Support versus confidence

1 Bayardo Jr., R.J. and Agrawal, R. (1999). Mining the Most Interesting Rules. In Proceedings of the Fifth ACM SIGKDD International Conference on Knowledge Discovery and Data Mining (pp. 145-154).
Generating a scatterplot
import pandas as pd
import seaborn as sns
from mlxtend.frequent_patterns import association_rules, apriori

# Load one-hot encoded MovieLens data
onehot = pd.read_csv('datasets/movies_onehot.csv')
# Generate frequent itemsets using Apriori
frequent_itemsets = apriori(onehot, min_support=0.01, use_colnames=True, max_len=2)

# Generate association rules
rules = association_rules(frequent_itemsets, metric='support', min_threshold=0.0)
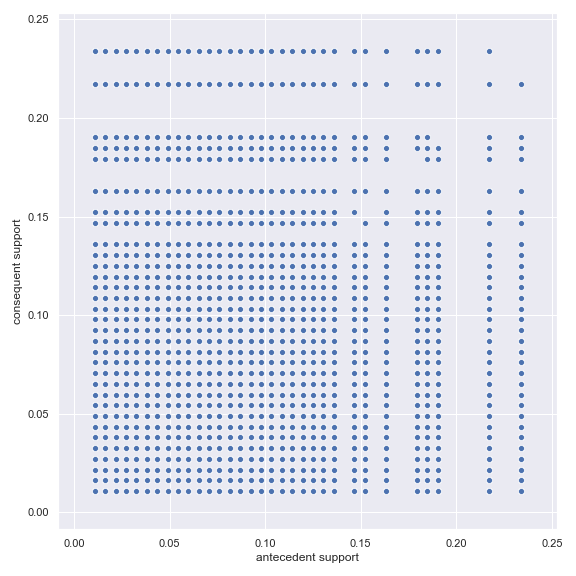
sns.scatterplot(x="antecedent support", y="consequent support", data=rules)
Generating a scatterplot

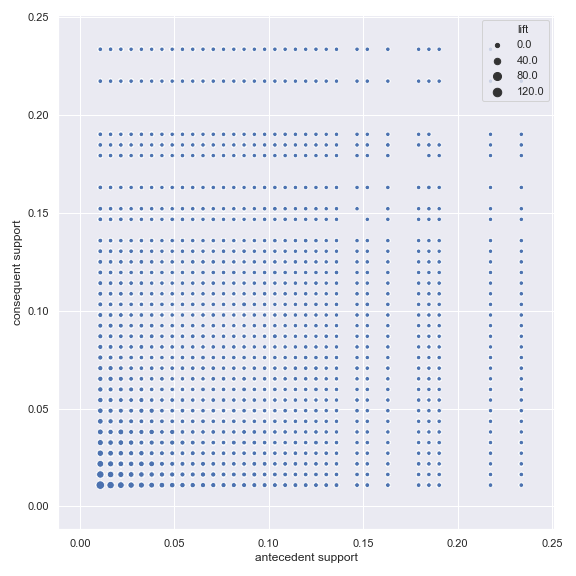
Adding a third metric
sns.scatterplot(x="antecedent support",
                y="consequent support",
                size="lift",
                data=rules)
Adding a third metric

What can we learn from scatterplots?
- Identify natural thresholds in data.
- Not possible with heatmaps or other visualizations.
- Visualize entire dataset.
- Not limited to small number of rules.
- Use findings to prune.
- Use natural thresholds and patterns to prune.
Let's practice!
Market Basket Analysis in Python

