Congratulations!

Cleaning Data in R

Maggie Matsui

Content Developer, DataCamp

What you learned

Same diagram from Lesson 1.1 showing diagnosing dirty data, side effects of dirty data, and cleaning data.

Cleaning Data in R

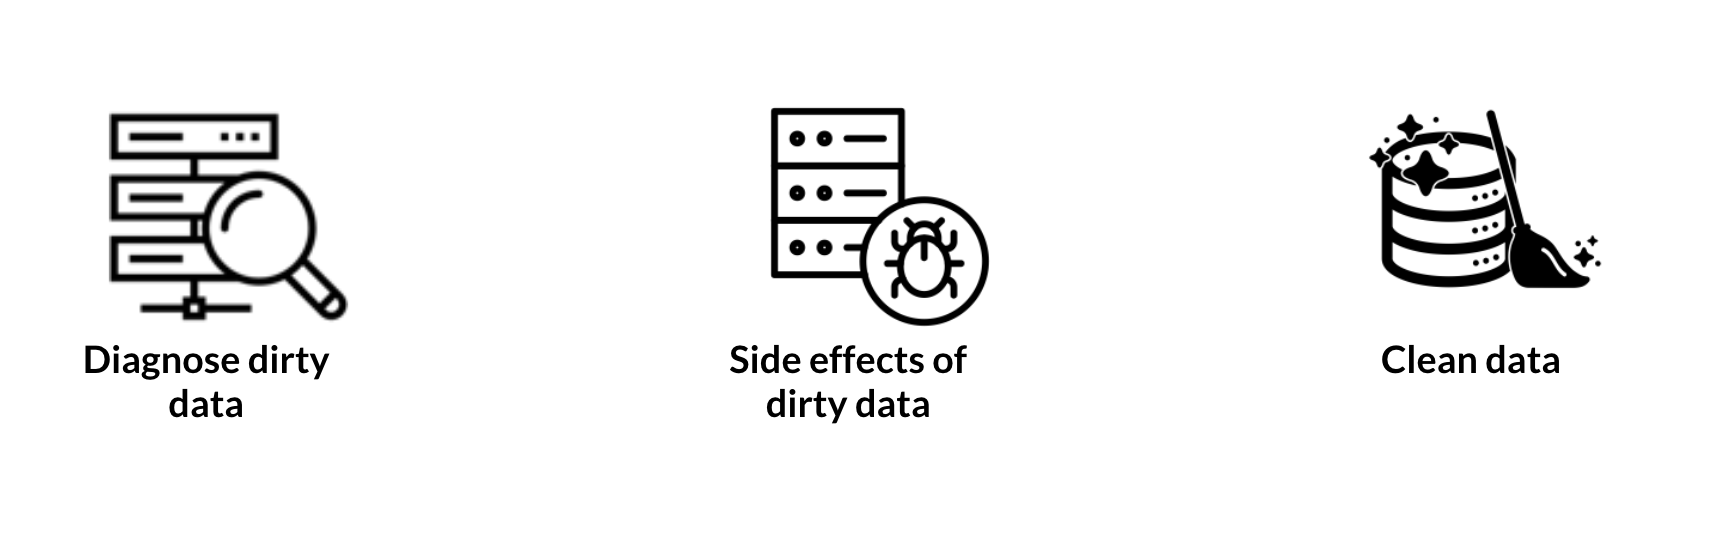
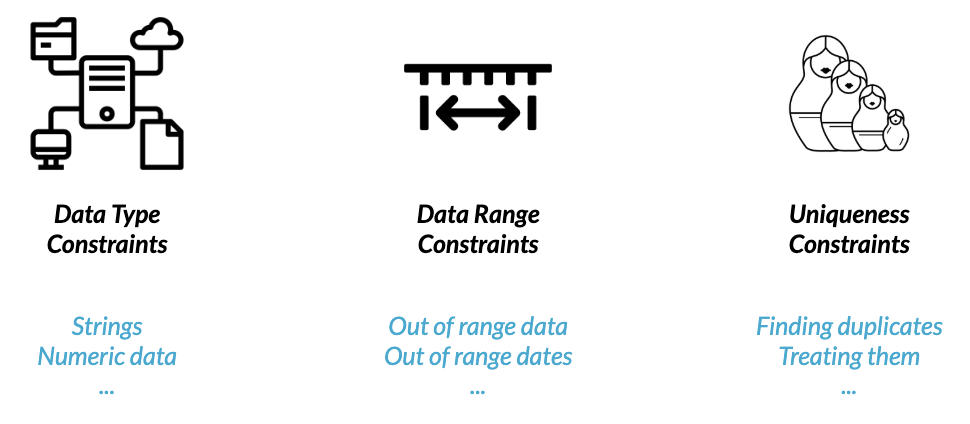
Chapter 1: Common Data Problems


Left: A tablet with lines going to it connected to a folder, cloud, database, and piece of paper to represent data type constraints, such as strings and numeric data. Middle: A number line with two markers and a double arrow between them to represent data range constraints, such as out of range data and out of range values. Right: Matryoshka Russian stacking dolls to represent uniqueness constraints such as finding duplicates and treating them.

Cleaning Data in R

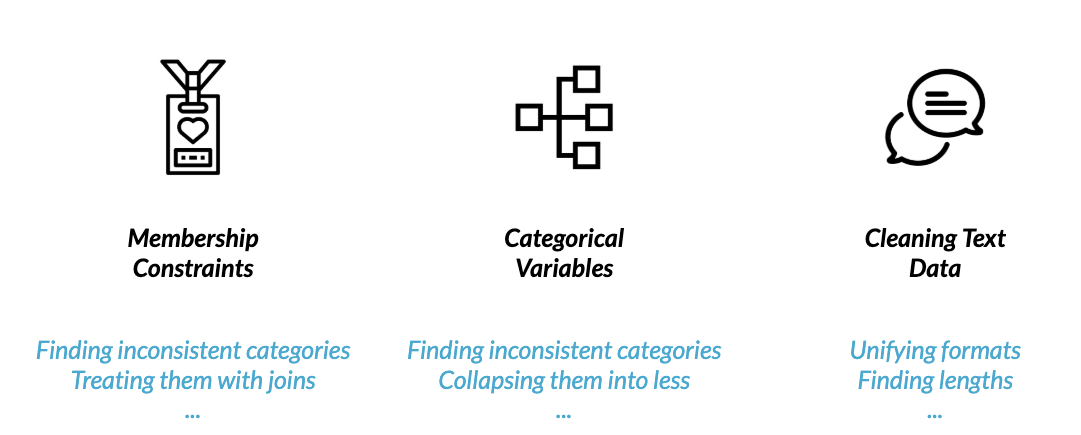
Chapter 2: Text and Categorical Data

Left: A security access badge to represent membership constraints such as finding inconsistent categories and treating them with joins. Middle: Squares linked by lines to represent categorical variables such as finding inconsistent categories and collapsing them into fewer categories. Right: Two text bubbles to represent cleaning text data, such as unifying formats and finding lengths.

Cleaning Data in R

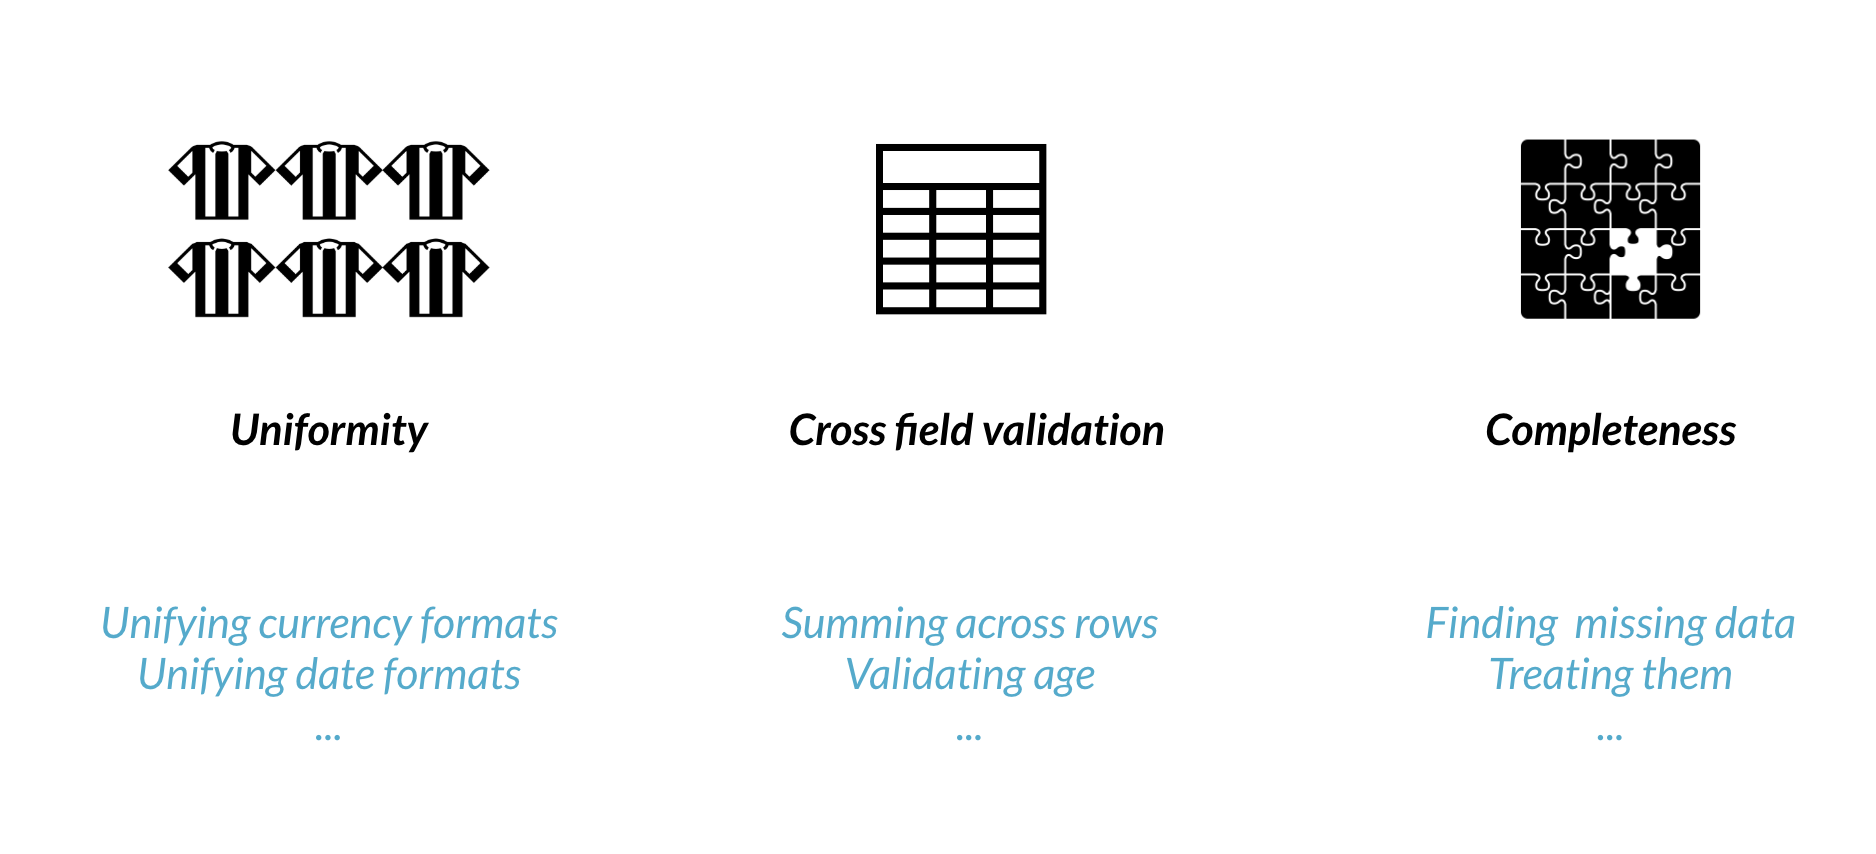
Chapter 3: Advanced Data Problems

Left: Six referee uniforms to represent uniformity, such as unifying currency formats and unifying date formats. Middle: Data table with three columns to represent cross field validation, such as summing across rows and validating age. Right: Puzzle with missing piece to represent completeness, such as finding missing data and treating it.

Cleaning Data in R

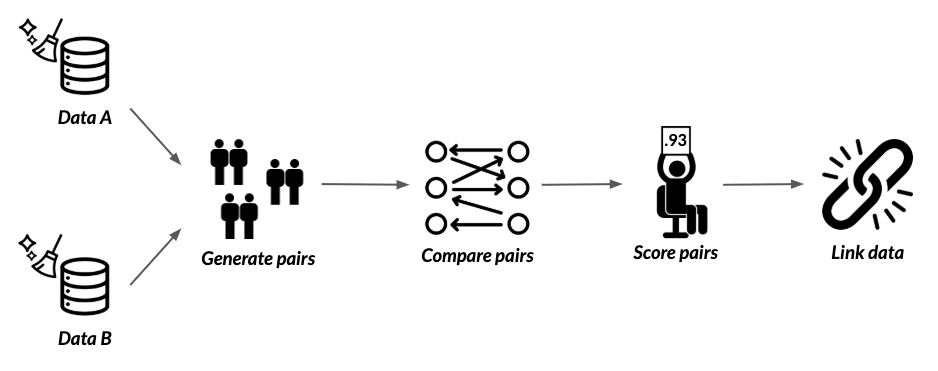
Chapter 4: Record Linkage

Diagram showing steps of record linkage

Cleaning Data in R

Expand and build upon your new skills

Cleaning Data in R

Congratulations!

Cleaning Data in R

Preparing Video For Download...