Introduction to R Markdown
Reporting with R Markdown

Amy Peterson
Head of Core Curriculum at DataCamp
R Markdown

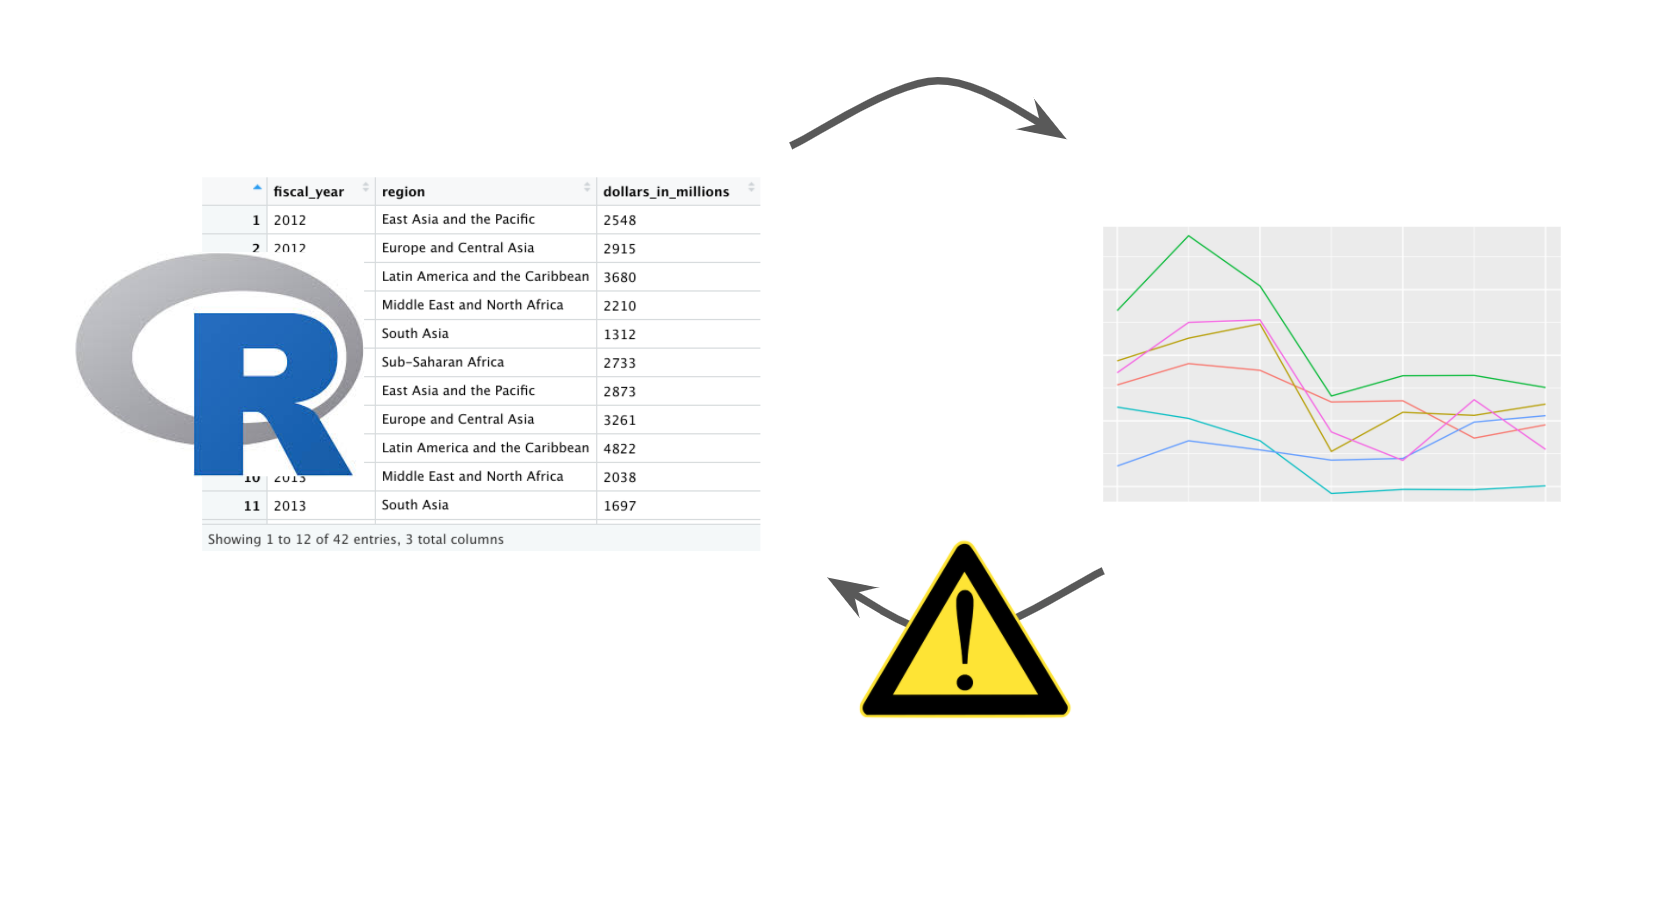
Reproducible results
Reproducible results
Reproducible results
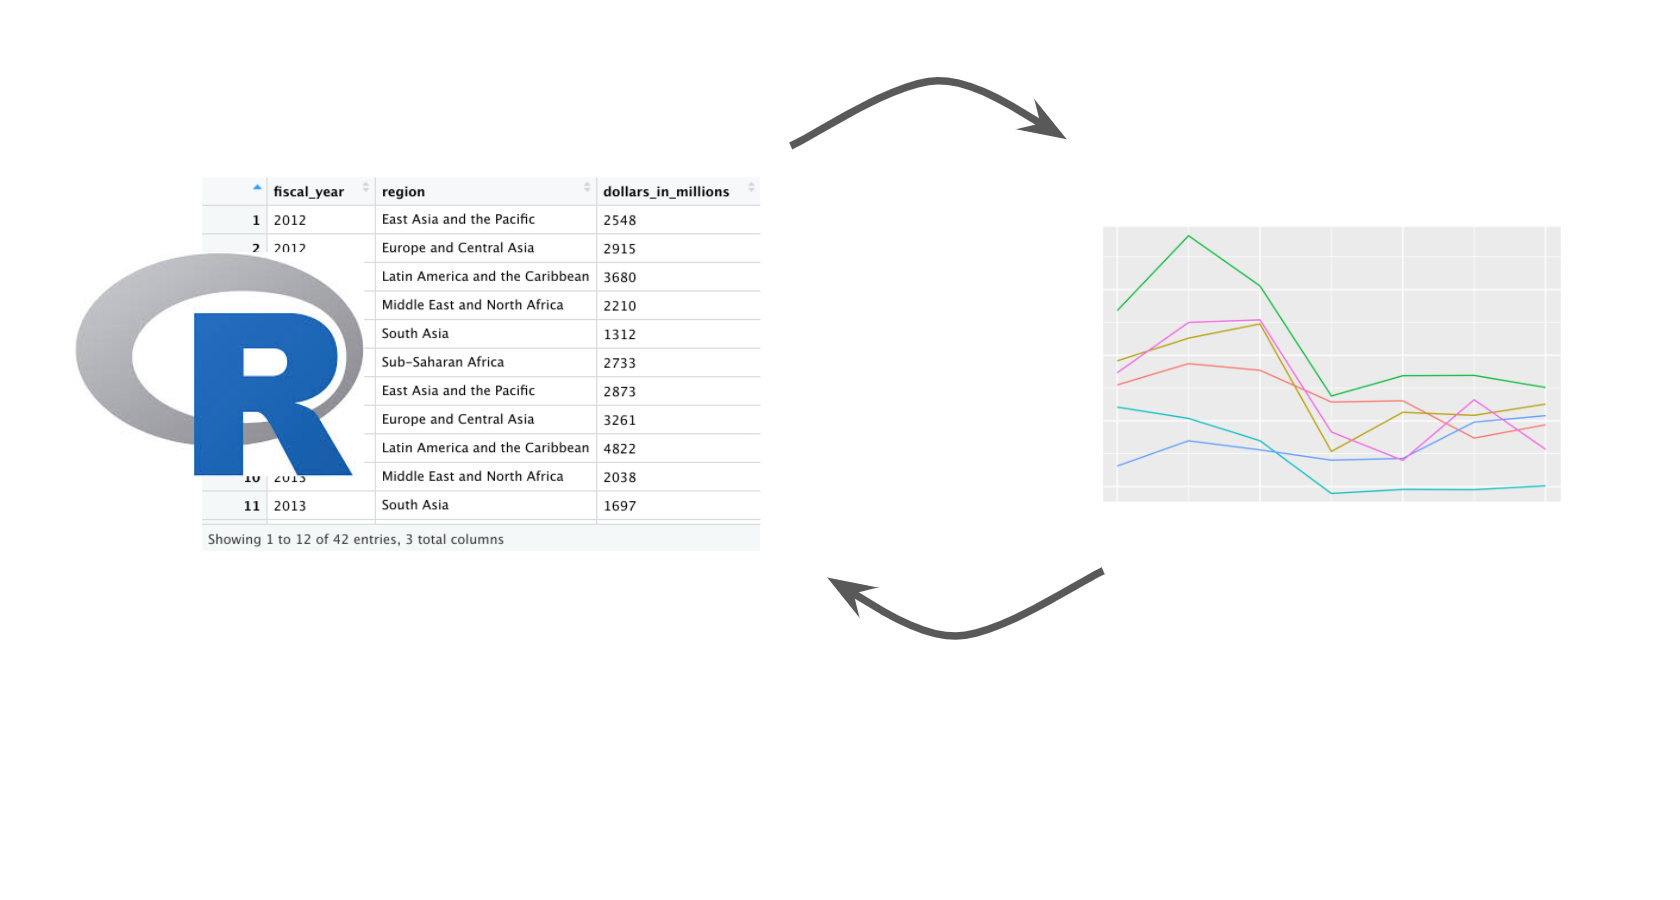
Reproducible results
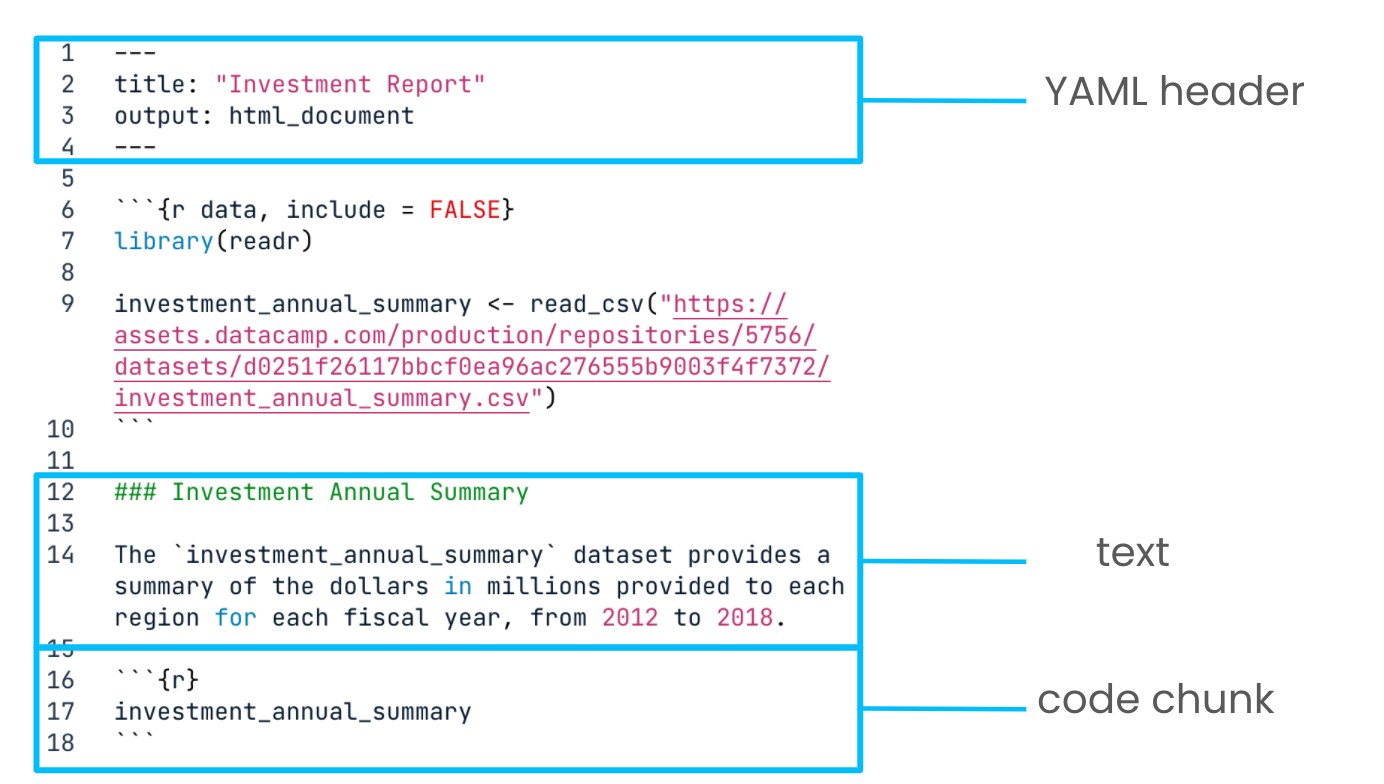
R Markdown elements
Code

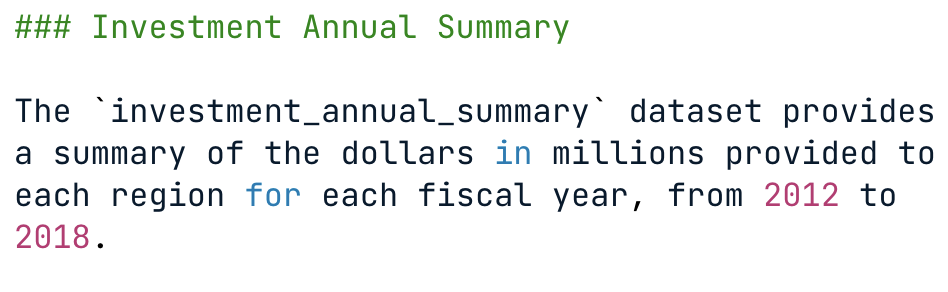
Text
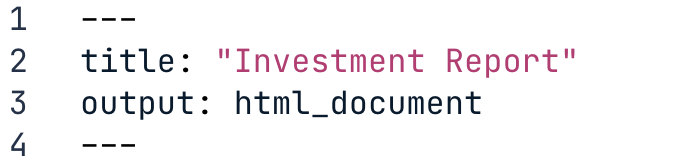
Metadata
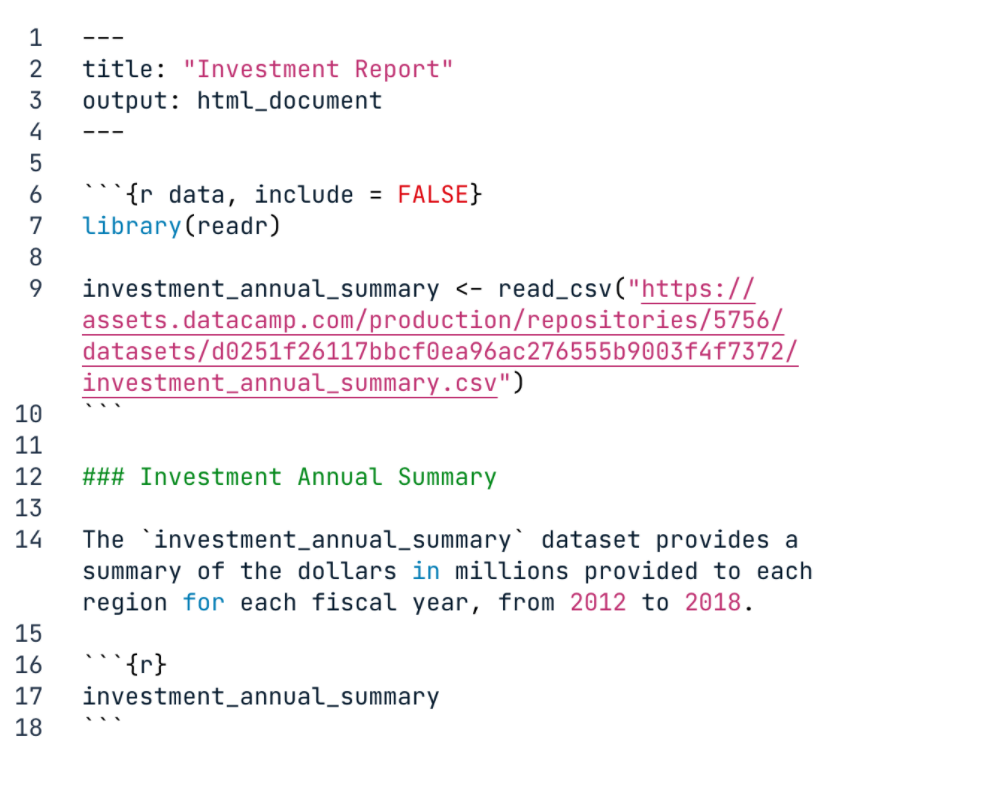
R Markdown file
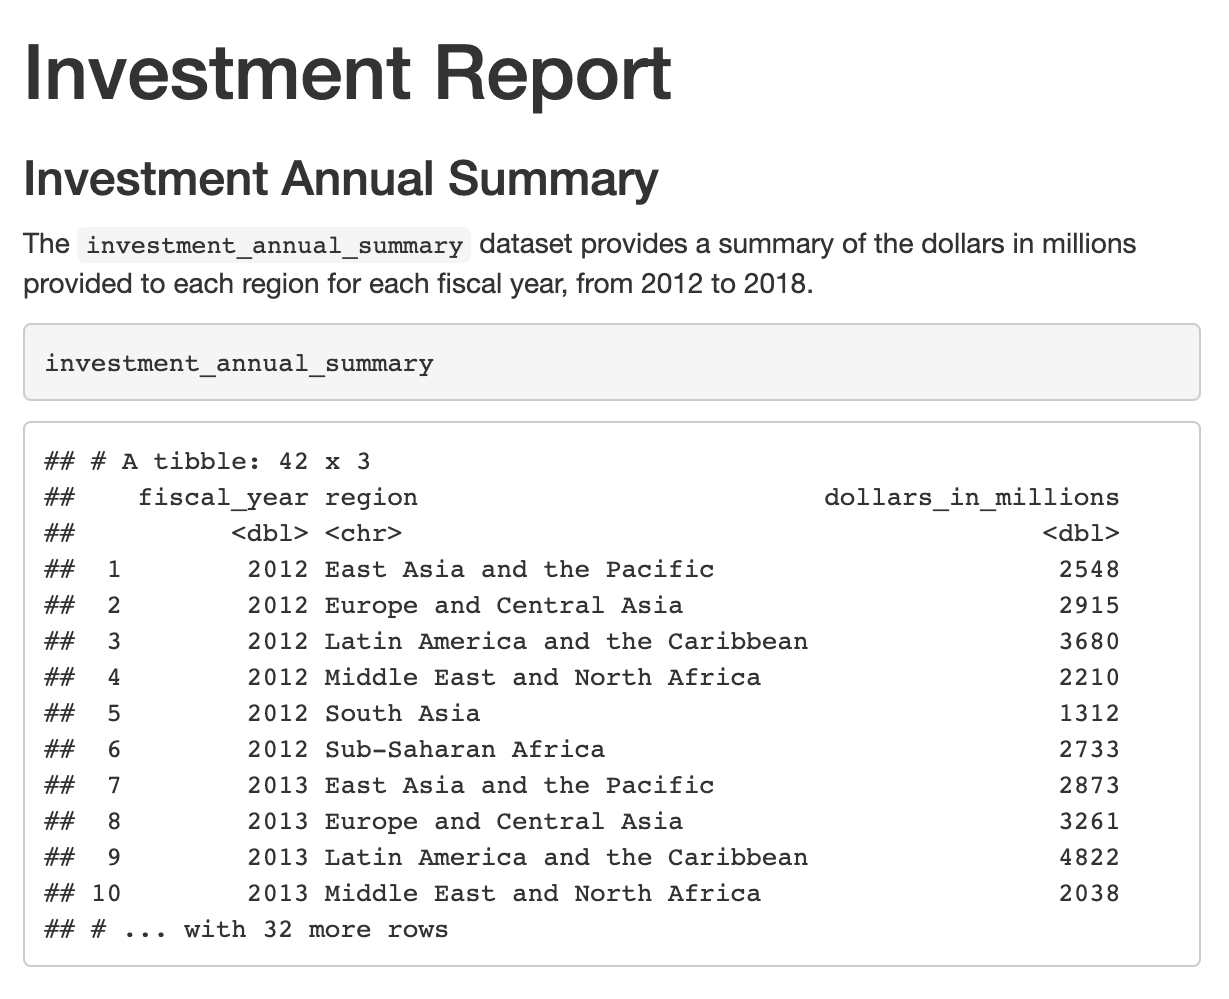
Knit
Course overview
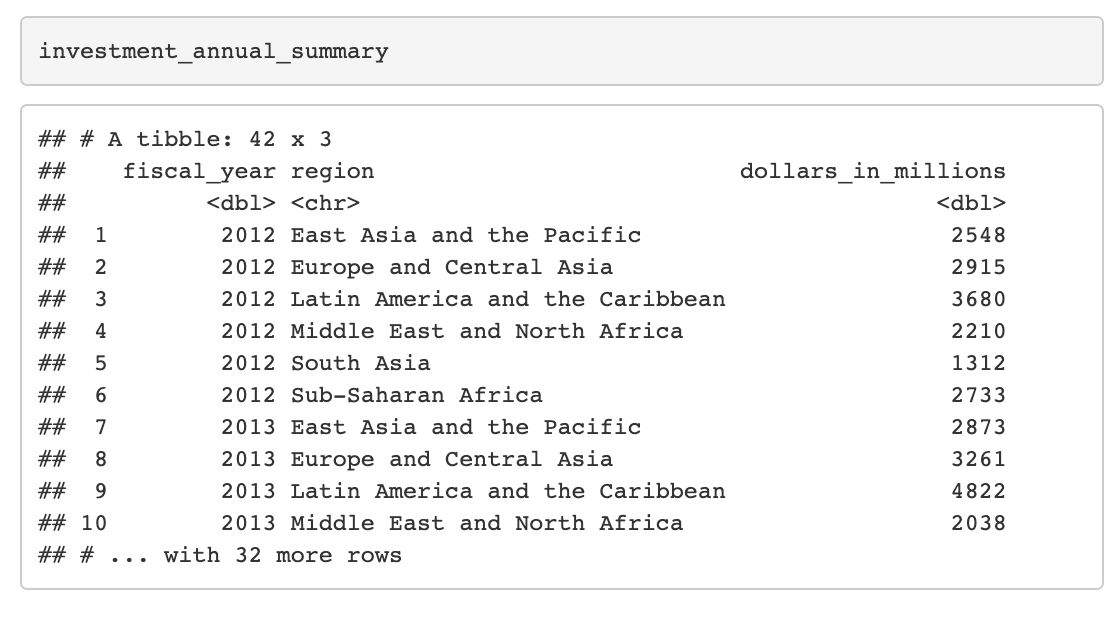
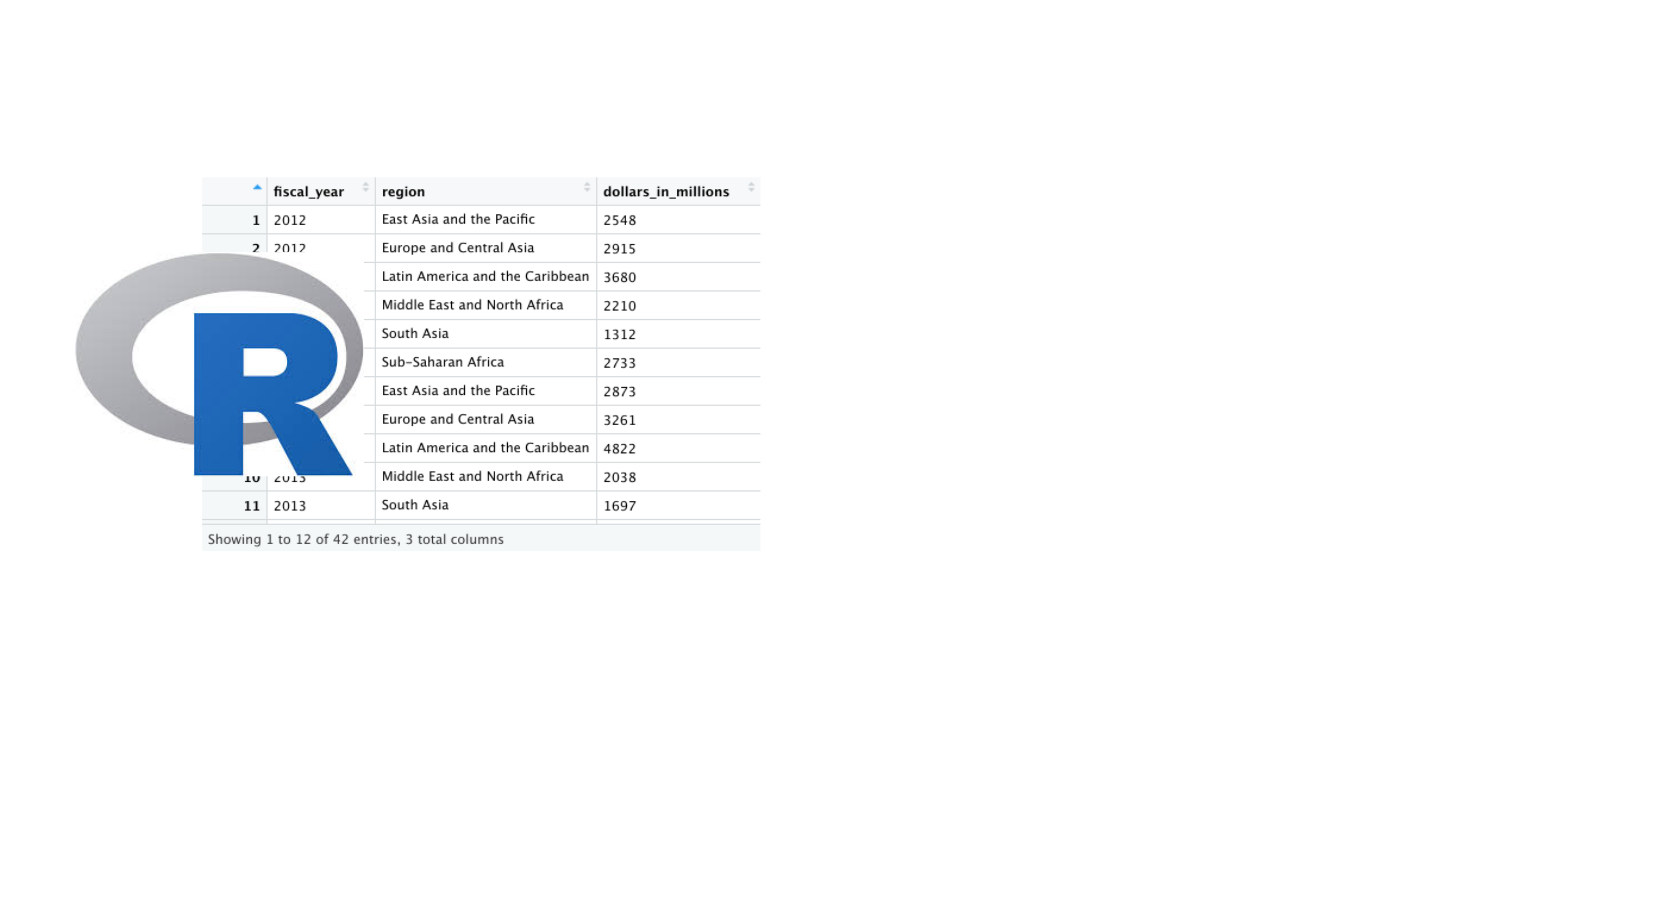
Elements of an R Markdown document
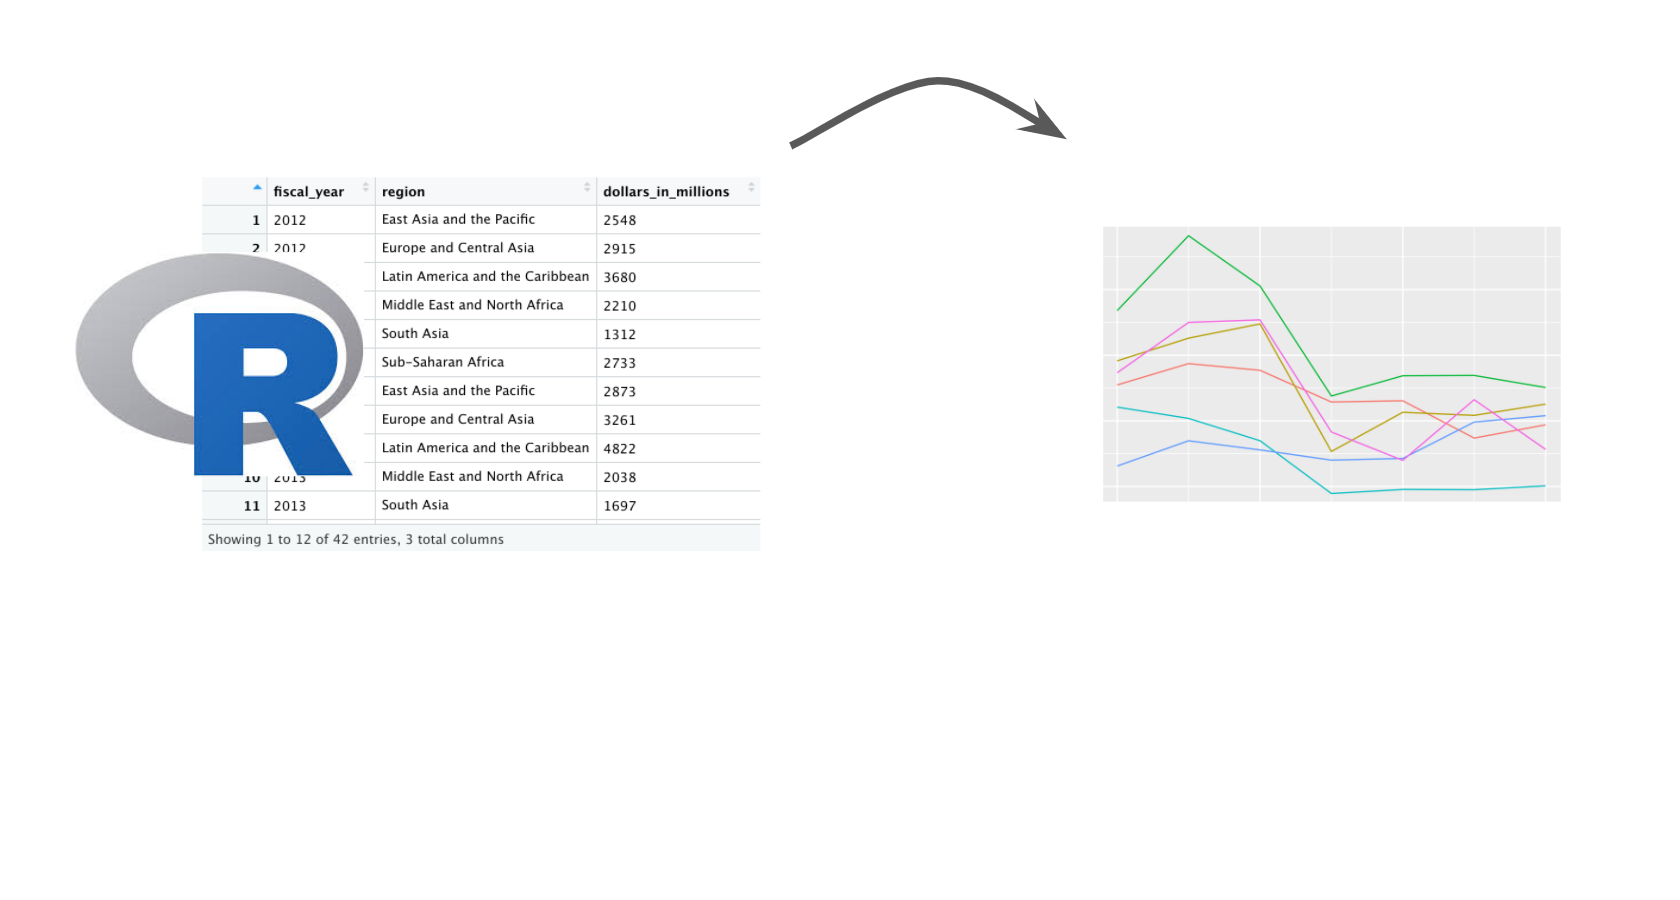
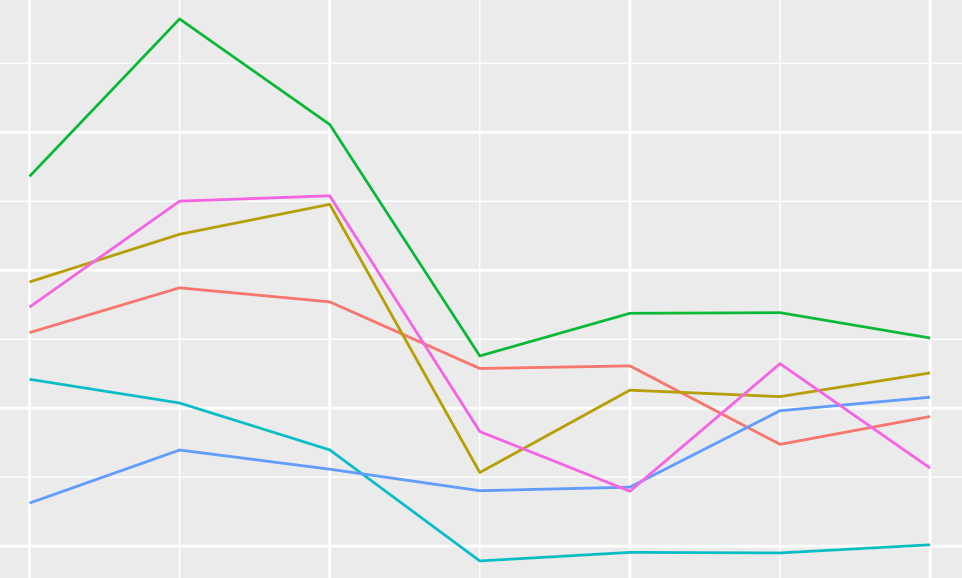
Add analyses and plots
Organize and improve a report

Customize fonts and colors
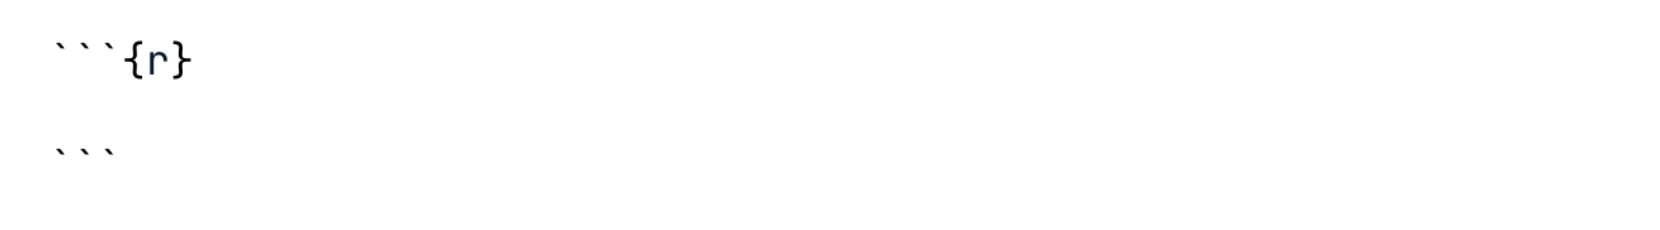
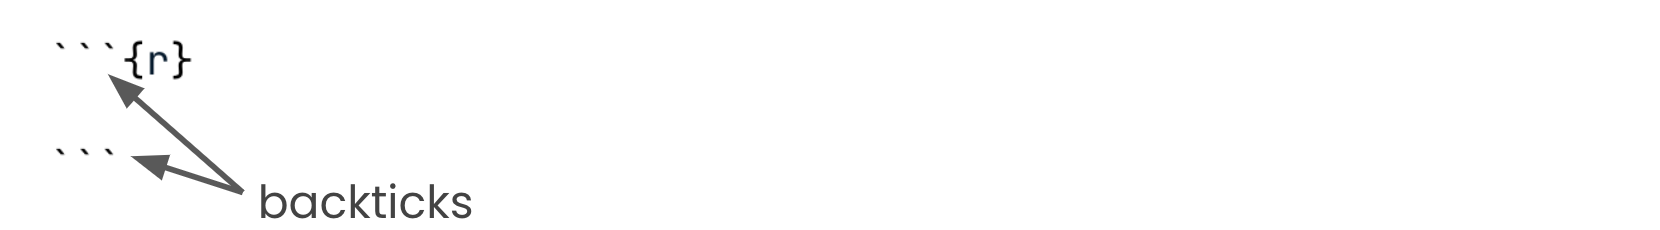
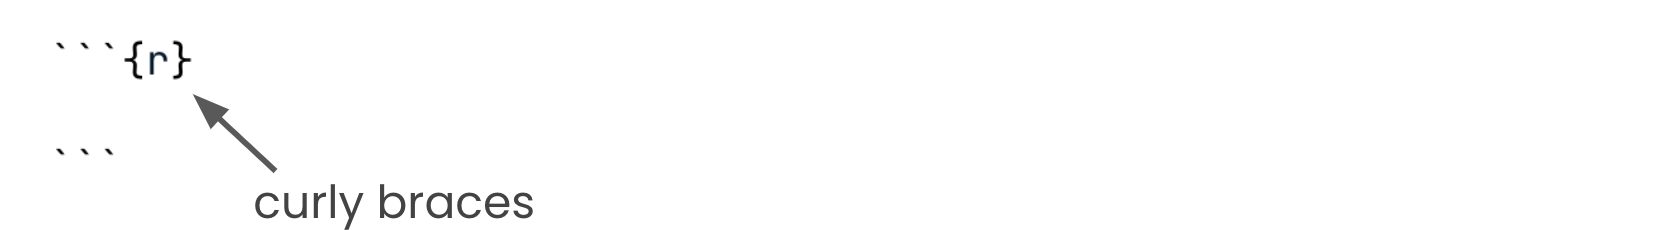
Code chunks
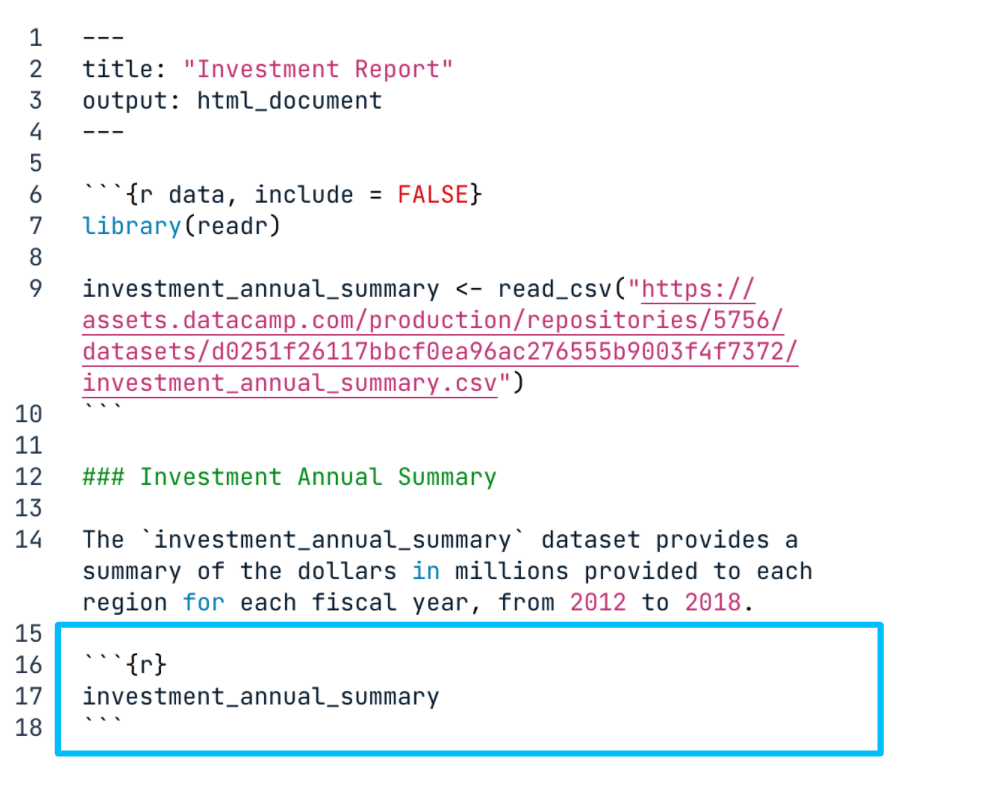
Adding code chunks
Adding code chunks
Adding code chunks
Adding code chunks

Adding code chunks