Correlation
Introduction to Statistics in R

Maggie Matsui
Content Developer, DataCamp
Relationships between two variables
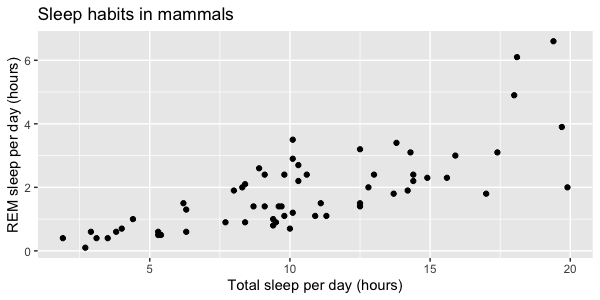
- x = explanatory/independent variable
- y = response/dependent variable
Magnitude = strength of relationship
0.99 (very strong relationship)
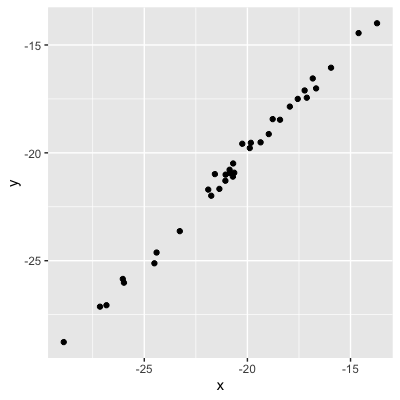
Magnitude = strength of relationship
0.99 (very strong relationship)
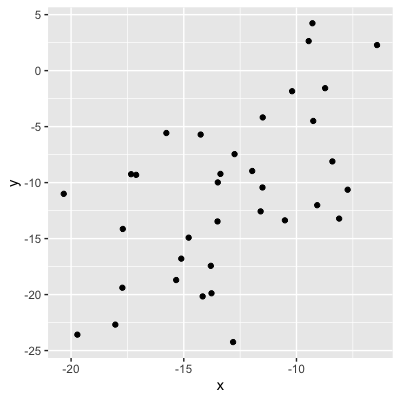
0.75 (strong relationship)
Magnitude = strength of relationship
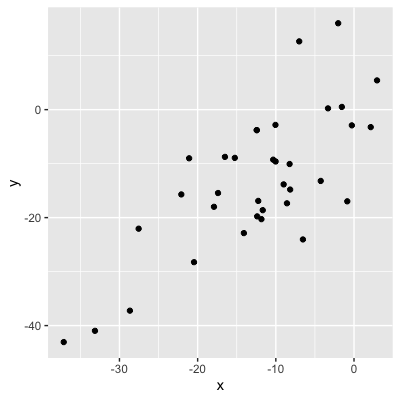
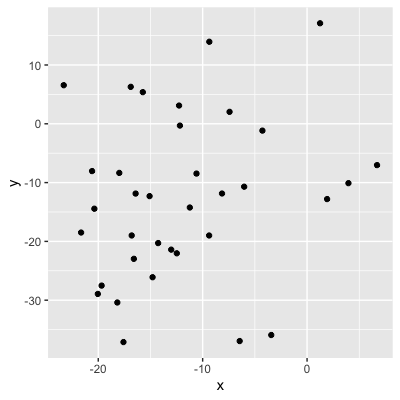
0.56 (moderate relationship)
Magnitude = strength of relationship
0.56 (moderate relationship)
0.21 (weak relationship)
Magnitude = strength of relationship
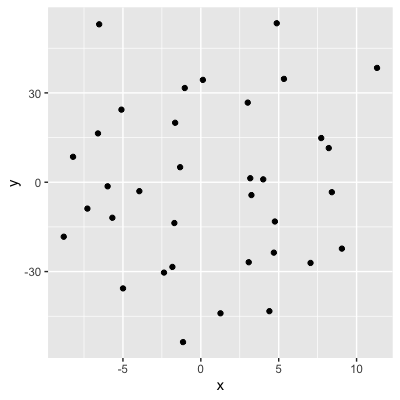
0.04 (no relationship)
Sign = direction
0.75: as x increases, y increases
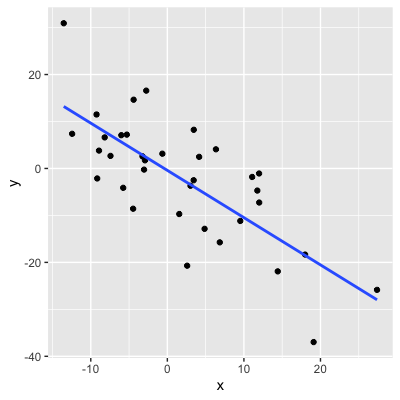
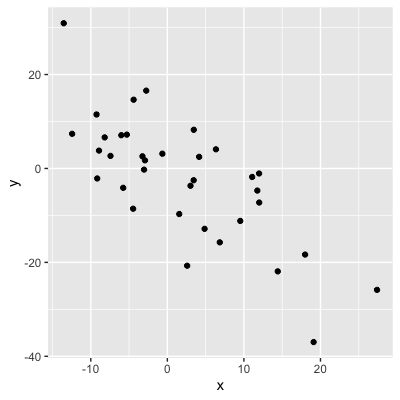
-0.75: as x increases, y decreases
Visualizing relationships
Adding a trendline