More probability distributions

Introduction to Statistics in R

Maggie Matsui

Content Developer, DataCamp

Exponential distribution

  • Probability of time between Poisson events

  • Examples

    • Probability of > 1 day between adoptions
    • Probability of < 10 minutes between restaurant arrivals
    • Probability of 6-8 months between earthquakes
  • Also uses lambda (rate)

  • Continuous (time)

Introduction to Statistics in R

Customer service requests

  • On average, one customer service ticket is created every 2 minutes
    • $\lambda$ = 0.5 customer service tickets created each minute

Exponential distribution with lambda = 0.5

Introduction to Statistics in R

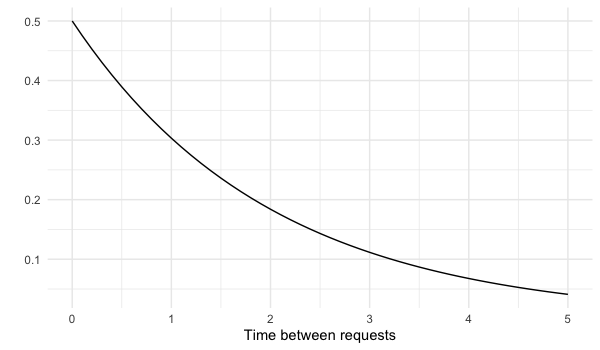
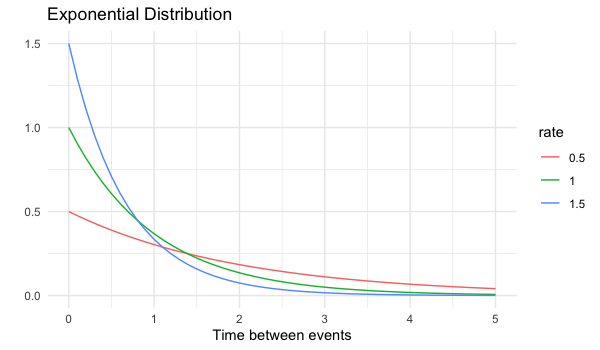
Lambda in exponential distribution

3 Exponential distributions with lambda = 0.5, lambda = 1, and lambda = 1.5

Introduction to Statistics in R

How long until a new request is created?

$P(\text{wait} < \text{1 min})$ =

pexp(1, rate = 0.5)
0.3934693

$P(\text{wait} > \text{4 min})$ =

pexp(4, rate = 0.5, lower.tail = FALSE)
0.1353353

$P(\text{1 min} < \text{wait} < \text{4 min})$ =

pexp(4, rate = 0.5) - pexp(1, rate = 0.5)
0.4711954
Introduction to Statistics in R

Expected value of exponential distribution

In terms of rate (Poisson):

  • $\lambda$ = $0.5$ requests per minute


In terms of time (exponential):

  • $1/\lambda$ = $1$ request per $2$ minutes
Introduction to Statistics in R

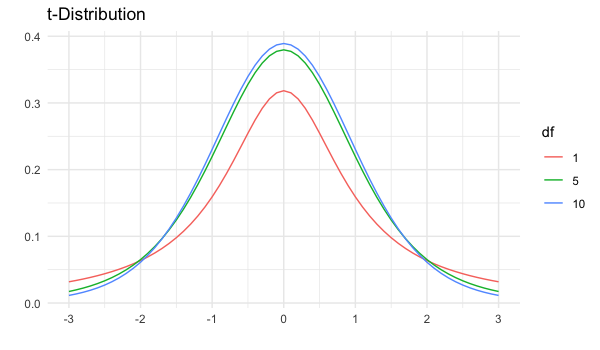
(Student's) t-distribution

  • Similar shape as the normal distribution
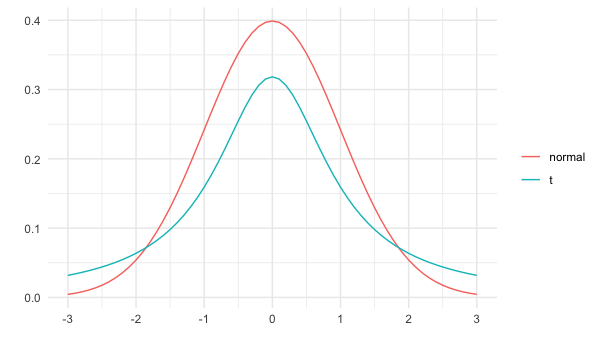
t-distribution and normal distribution plotted on same axes

Introduction to Statistics in R

Degrees of freedom

  • Has parameter degrees of freedom (df) which affects the thickness of the tails
    • Lower df = thicker tails, higher standard deviation
    • Higher df = closer to normal distribution

3 t distributions with df = 1, df = 5, and df = 10

Introduction to Statistics in R

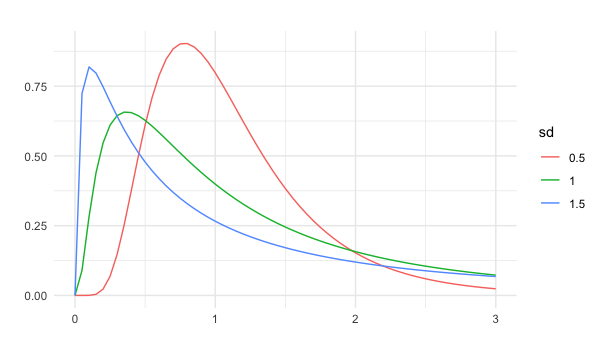
Log-normal distribution

  • Variable whose logarithm is normally distributed

  • Examples:

    • Length of chess games
    • Adult blood pressure
    • Number of hospitalizations in the 2003 SARS outbreak

3 log-normal distributions with sd = 0.5, sd = 1, and sd = 1.5

Introduction to Statistics in R

Let's practice!

Introduction to Statistics in R

Preparing Video For Download...