The binomial distribution
Introduction to Statistics in R

Maggie Matsui
Content Developer, DataCamp
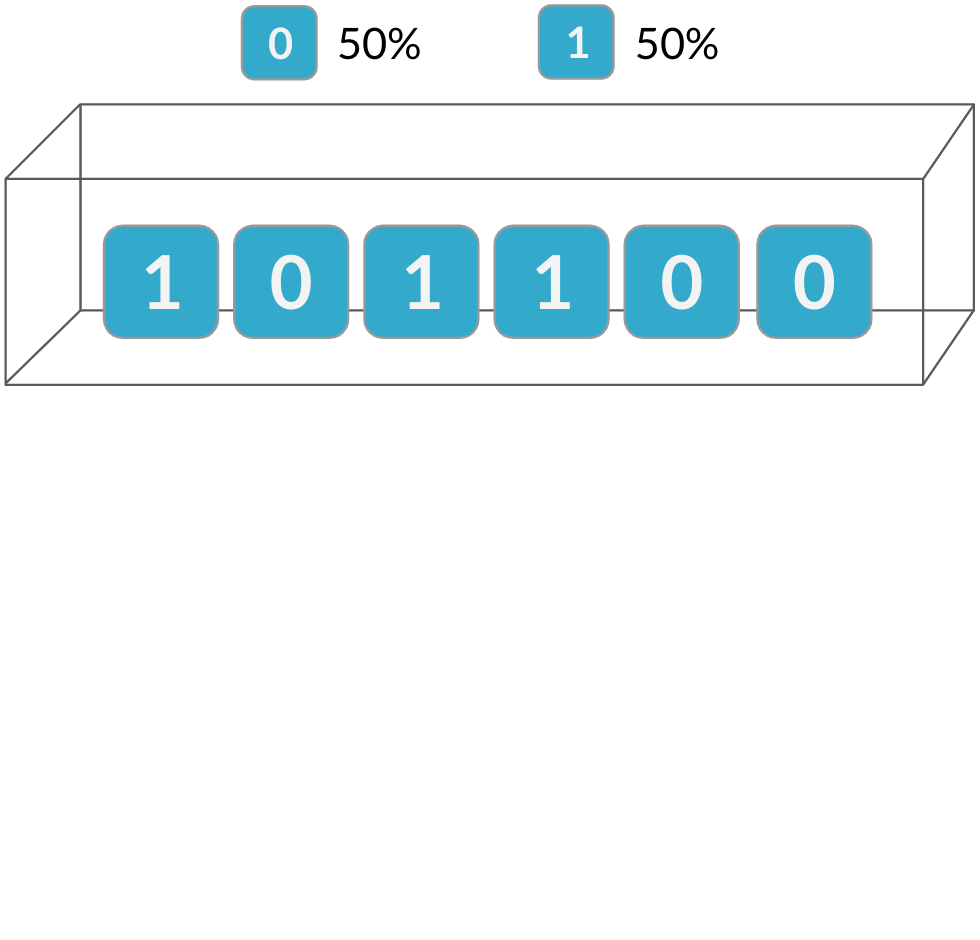
Coin flipping
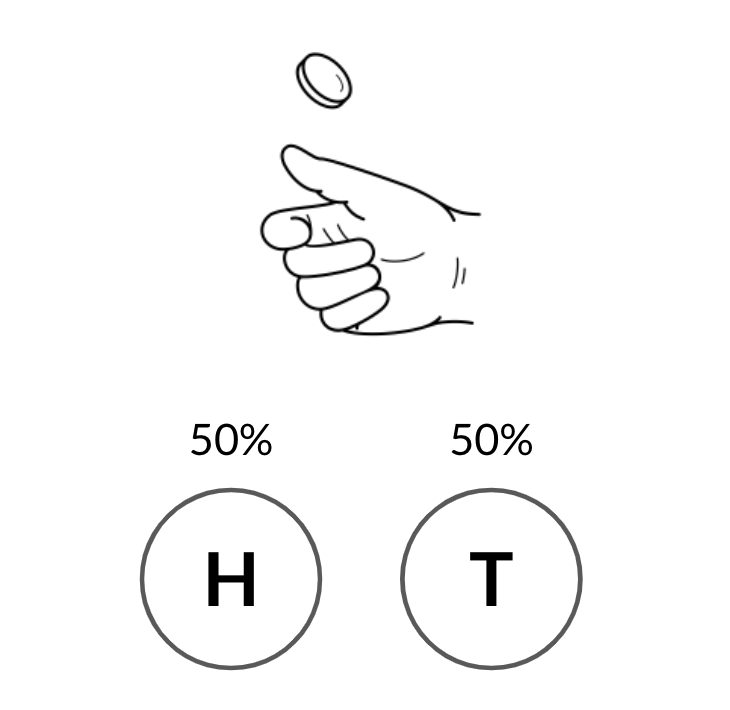
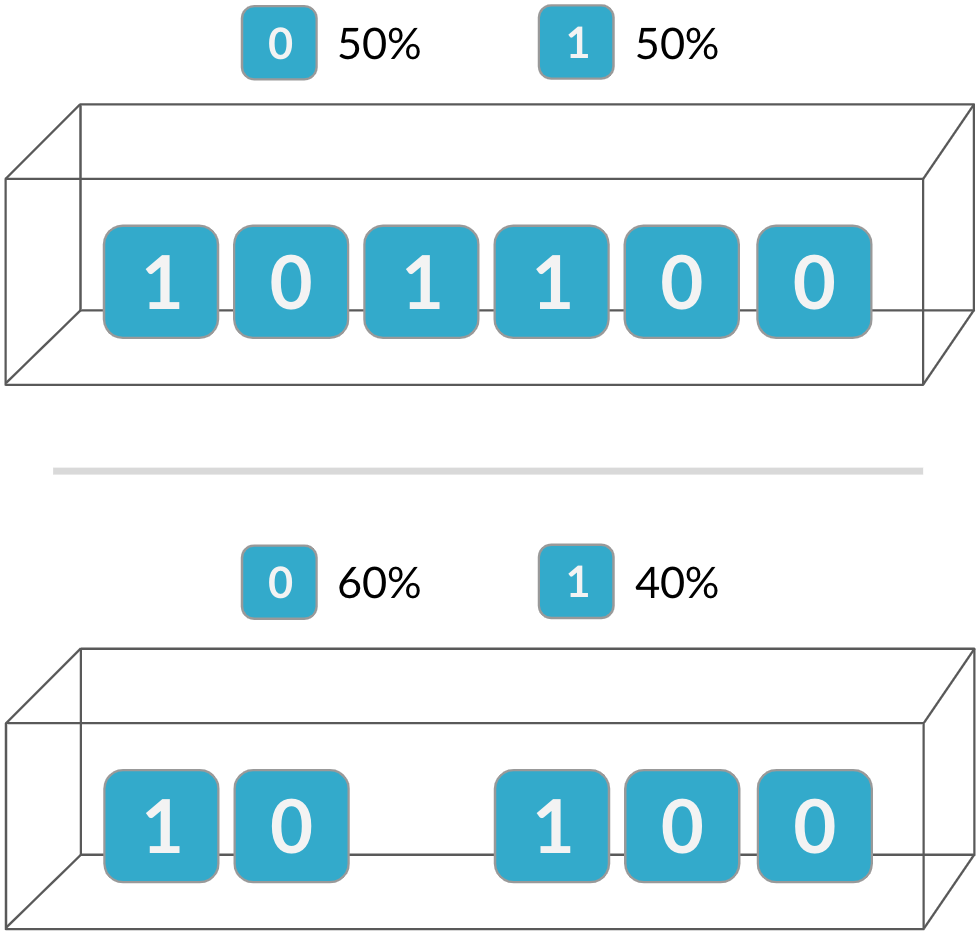
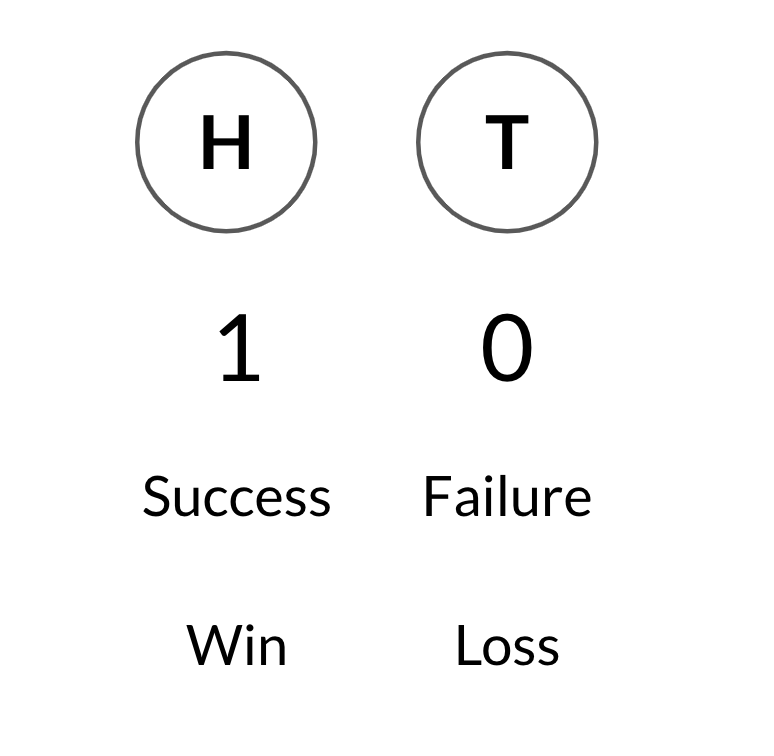
Binary outcomes
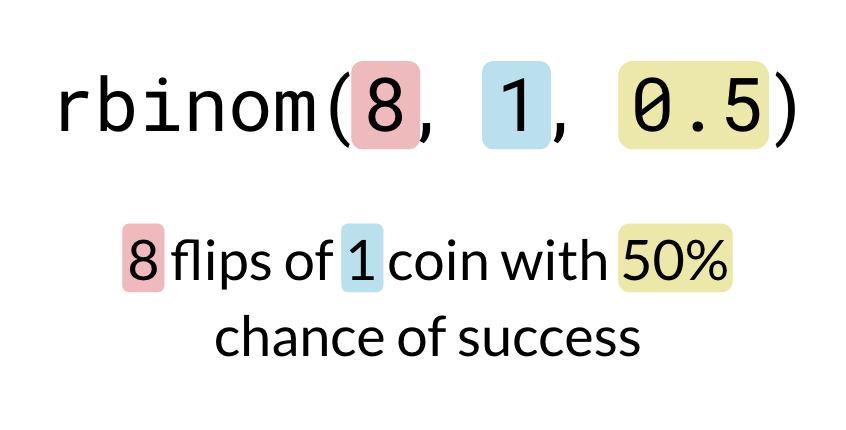
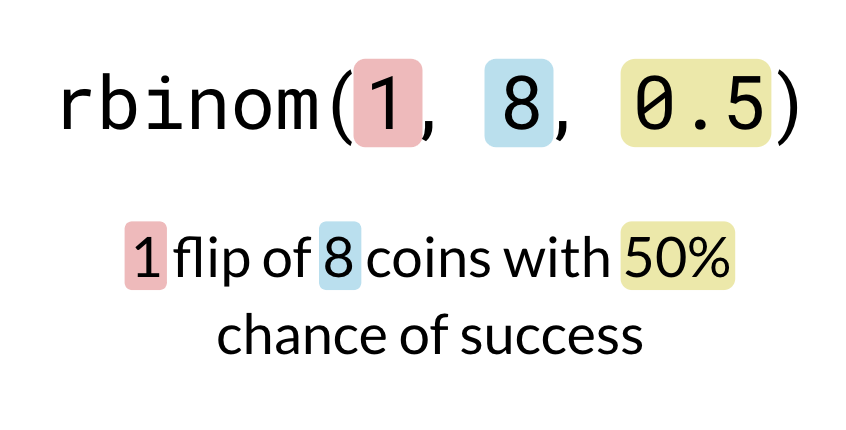
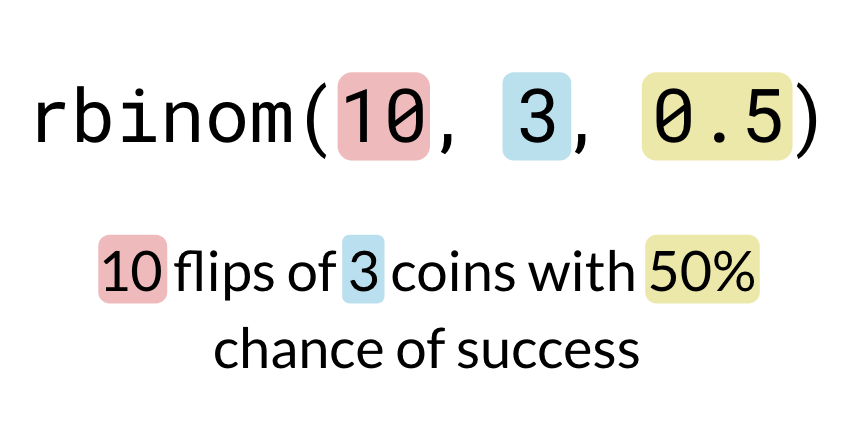
One flip many times
Many flips one time
Many flips many times
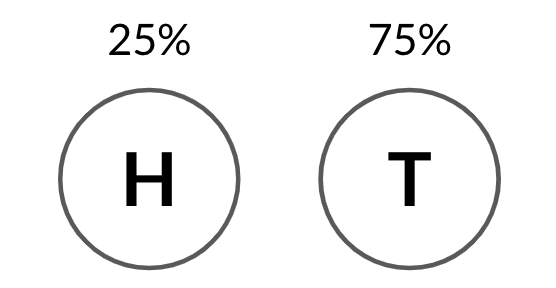
Other probabilities
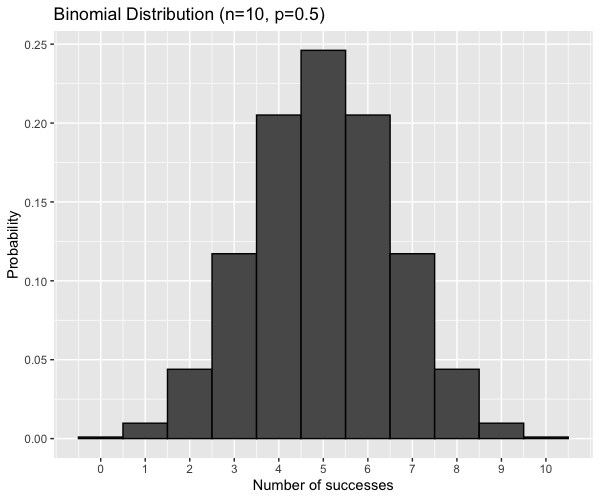
Binomial distribution
Probability distribution of the number of successes in a sequence of independent trials
E.g. Number of heads in a sequence of coin flips
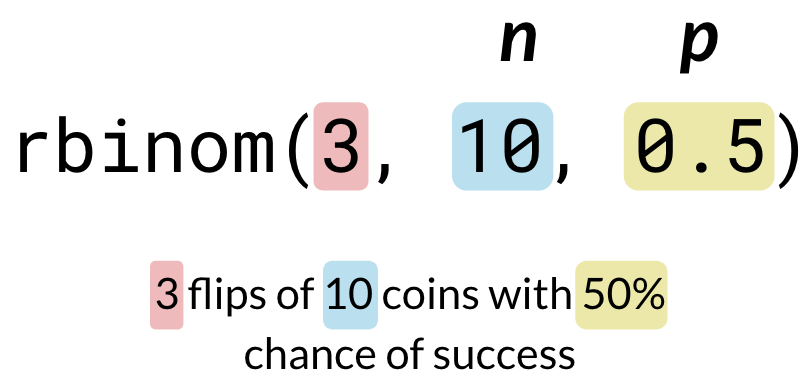
Described by $n$ and $p$
- $n$: total number of trials
- $p$: probability of success
Independence
Independence