What is statistics?
Introduction to Statistics in R

Maggie Matsui
Content Developer, DataCamp
What is statistics?
The field of statistics - the practice and study of collecting and analyzing data
A summary statistic - a fact about or summary of some data
What is statistics?
The field of statistics - the practice and study of collecting and analyzing data
A summary statistic - a fact about or summary of some data
What can statistics do?
- How likely is someone to purchase a product? Are people more likely to purchase it if they can use a different payment system?
- How many occupants will your hotel have? How can you optimize occupancy?
- How many sizes of jeans need to be manufactured so they can fit 95% of the population? Should the same number of each size be produced?
- A/B tests: Which ad is more effective in getting people to purchase a product?
What can't statistics do?
- Why is Game of Thrones so popular?
Instead...
- Are series with more violent scenes viewed by more people?
But...
- Even so, this can't tell us if more violent scenes lead to more views
Types of statistics
Descriptive statistics
- Describe and summarize data

- 50% of friends drive to work
- 25% take the bus
- 25% bike
Inferential statistics
- Use a sample of data to make inferences about a larger population

What percent of people drive to work?
Types of data
Numeric (Quantitative)
- Continuous (Measured)
- Airplane speed
- Time spent waiting in line
- Discrete (Counted)
- Number of pets
- Number of packages shipped
Categorical (Qualitative)
- Nominal (Unordered)
- Married/unmarried
- Country of residence
- Ordinal (Ordered)

Categorical data can be represented as numbers
Nominal (Unordered)
- Married/unmarried (
1/0) - Country of residence (
1,2, ...)
Ordinal (Ordered)
- Strongly disagree (
1) - Somewhat disagree (
2) - Neither agree nor disagree (
3) - Somewhat agree (
4) - Strongly agree (
5)
Why does data type matter?
Summary statistics
car_speeds %>%
  summarize(avg_speed = mean(speed_mph))
  avg_speed
1  40.09062
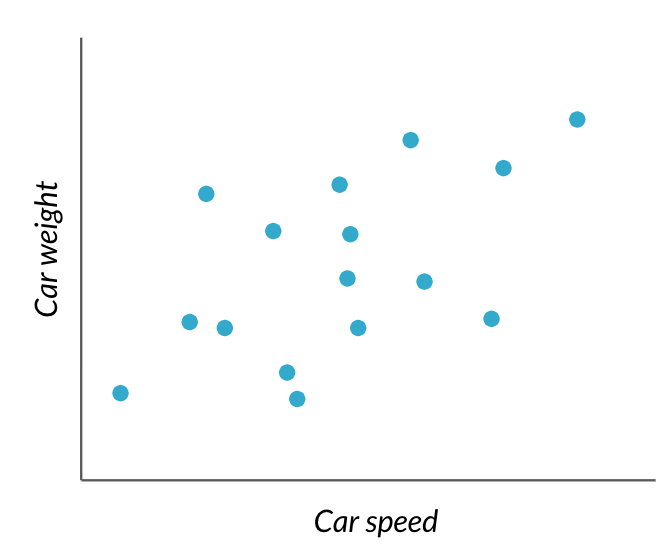
Plots

Why does data type matter?
Summary statistics
demographics %>%
  count(marriage_status)
  marriage_status     n
1          single   188
2         married   143
3        divorced   124
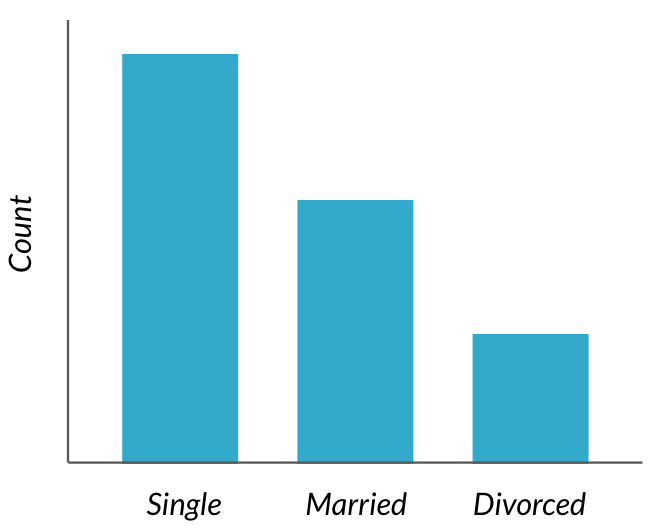
Plots

Let's practice!
Introduction to Statistics in R

