Continuous distributions

Introduction to Statistics in R

Maggie Matsui

Content Developer, DataCamp

Waiting for the bus

timeline from 1 to 2 pm with 6 bus arrivals, one every 12 mins

Introduction to Statistics in R

Continuous uniform distribution

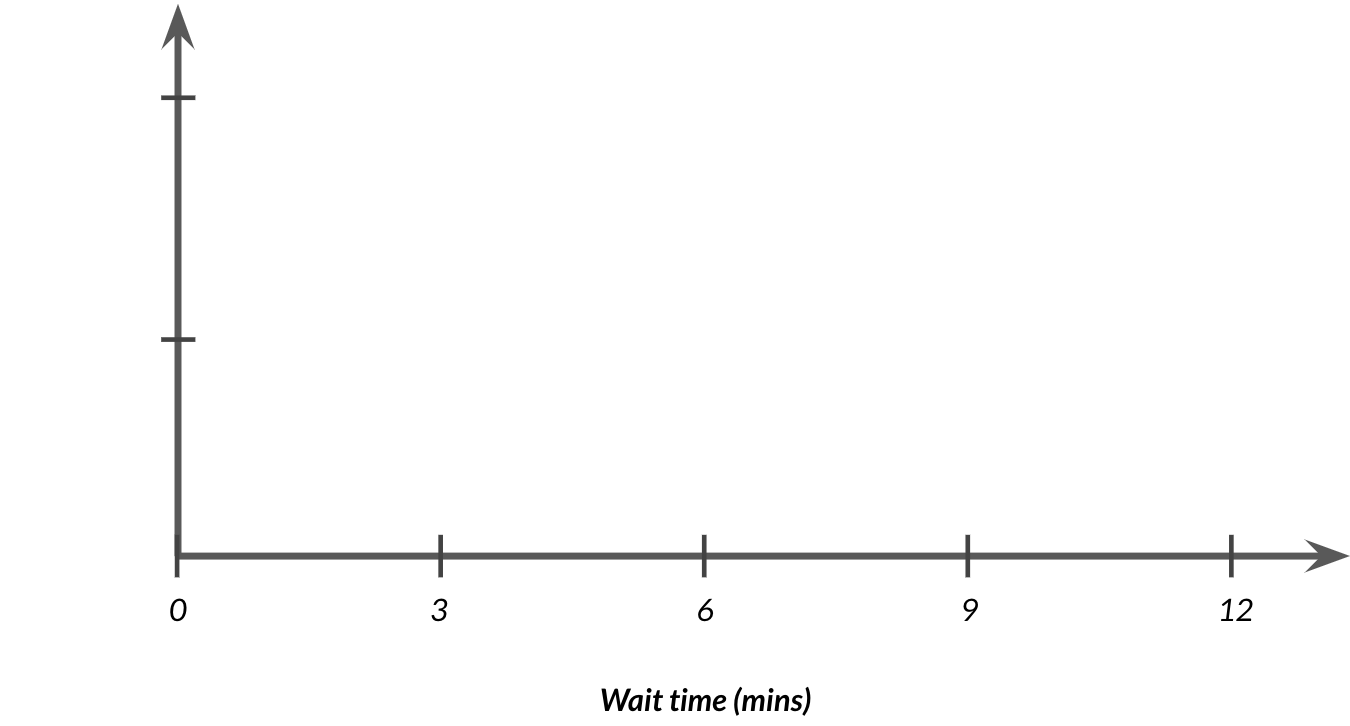
Set of axes with wait time on the x axis

Introduction to Statistics in R

Continuous uniform distribution

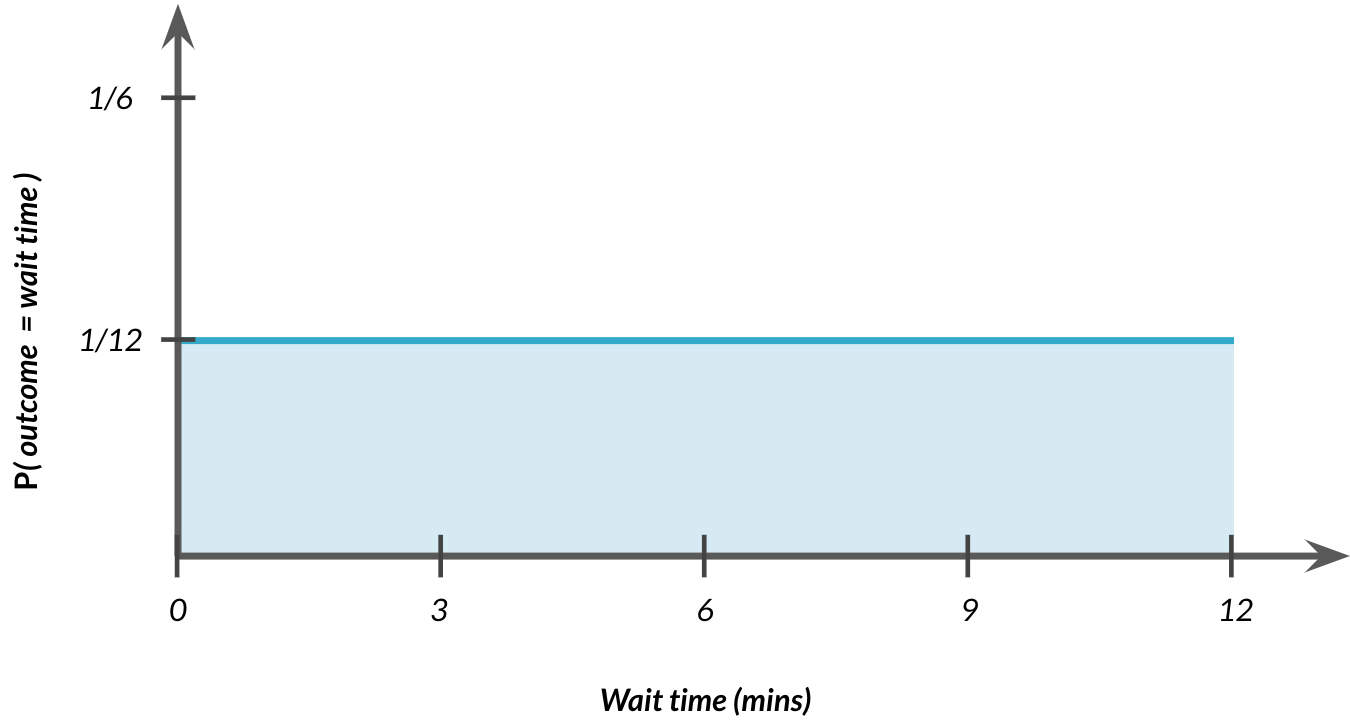
Y axis becomes P(outcome = wait time) with a horizontal line going across the graph at 1/12

Introduction to Statistics in R

Probability still = area

$$P(4 \le \text{wait time} \le 7) = ~~ ?$$
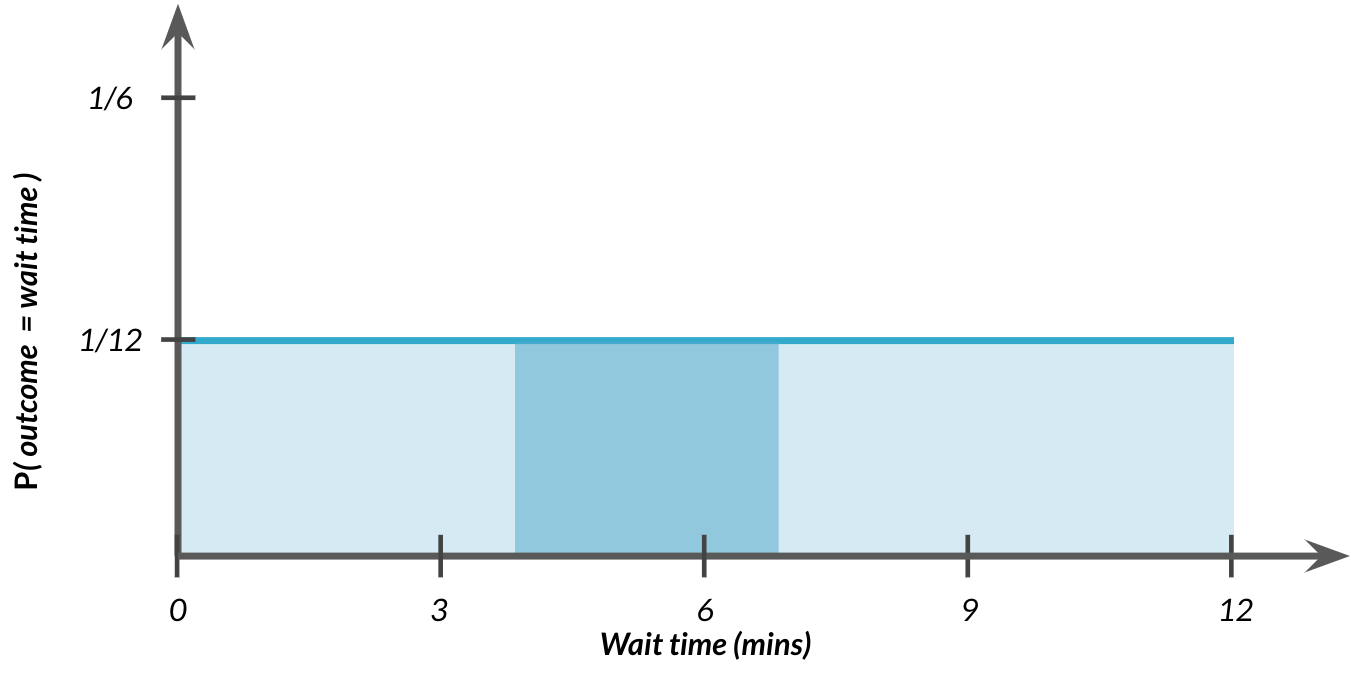
Area between 4 and 7 highlighted under the horizontal line

Introduction to Statistics in R

Probability still = area

$$P(4 \le \text{wait time} \le 7) = ~~ ?$$
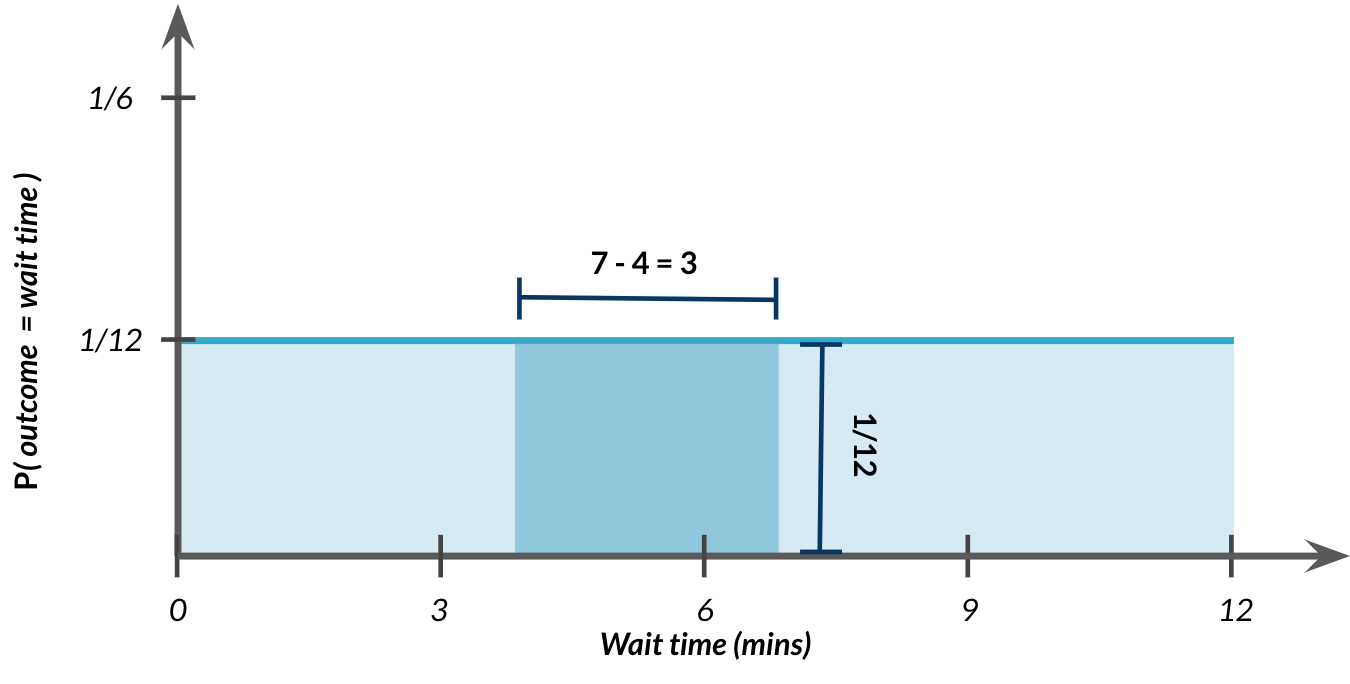
Width of highlighted area is 7-4=3, height is 1/12

Introduction to Statistics in R

Probability still = area

$$P(4 \le \text{wait time} \le 7) = 3 \times 1/12 = 3/12$$

Width of highlighted area is 7-4=3, height is 1/12

Introduction to Statistics in R

Uniform distribution in R

$$ P(\text{wait time} \le 7)$$

Area highlighted from 0 to 7 under horizontal line

punif(7, min = 0, max = 12)
0.5833333
Introduction to Statistics in R

lower.tail

$$ P(\text{wait time} \ge 7)$$

Area highlighted from 7 to 12

punif(7, min = 0, max = 12, lower.tail = FALSE)
0.4166667
Introduction to Statistics in R

$$ P(4 \le \text{wait time} \le 7)$$

Area highlighted from 4 to 7

Introduction to Statistics in R

$$ P(4 \le \text{wait time} \le 7)$$

Area highlighted from 0 to 7

Introduction to Statistics in R

$$ P(4 \le \text{wait time} \le 7)$$

Area from 0-4 lightly highlighted, area from 4-7 highlighted darker

punif(7, min = 0, max = 12) - punif(4, min = 0, max = 12)
0.25
Introduction to Statistics in R

Total area = 1

$$P(0 \le \text{wait time} \le 12) = ~~ ?$$
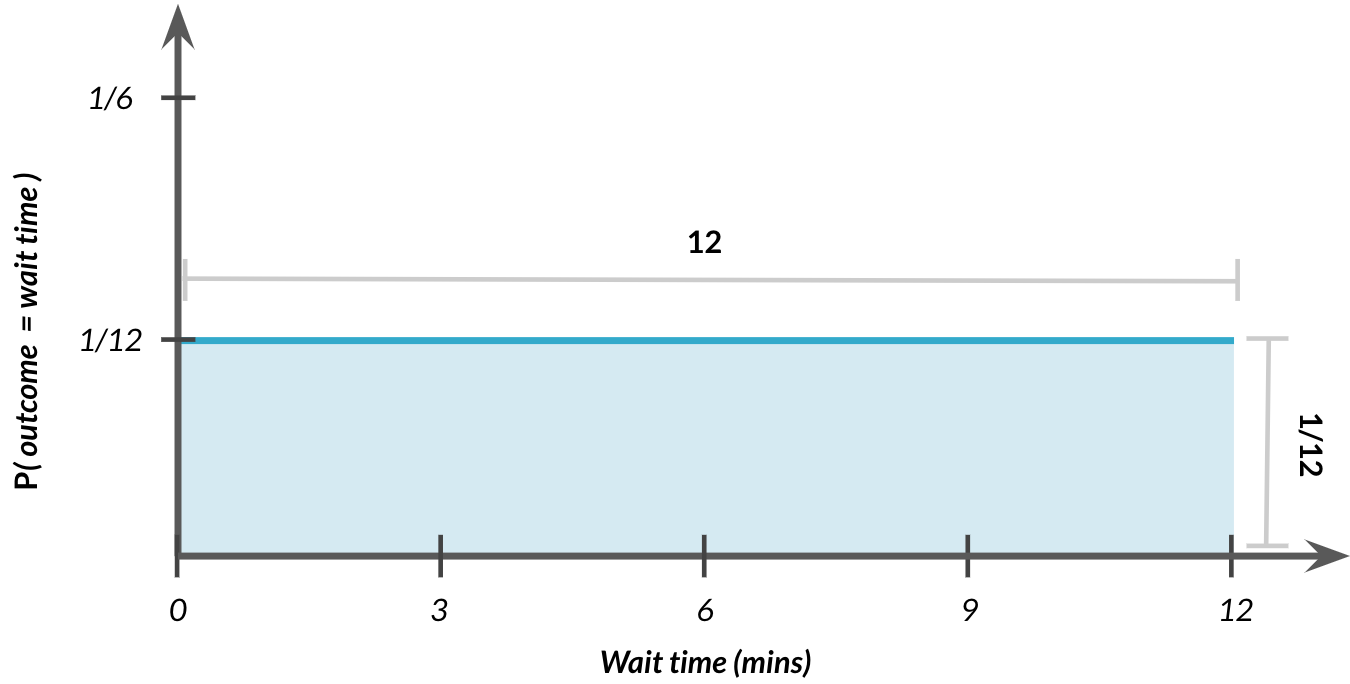
Width of distribution = 1, height = 1/12

Introduction to Statistics in R

Total area = 1

$$P(0 \le \text{outcome} \le 12) = 12 \times 1/12 = 1$$
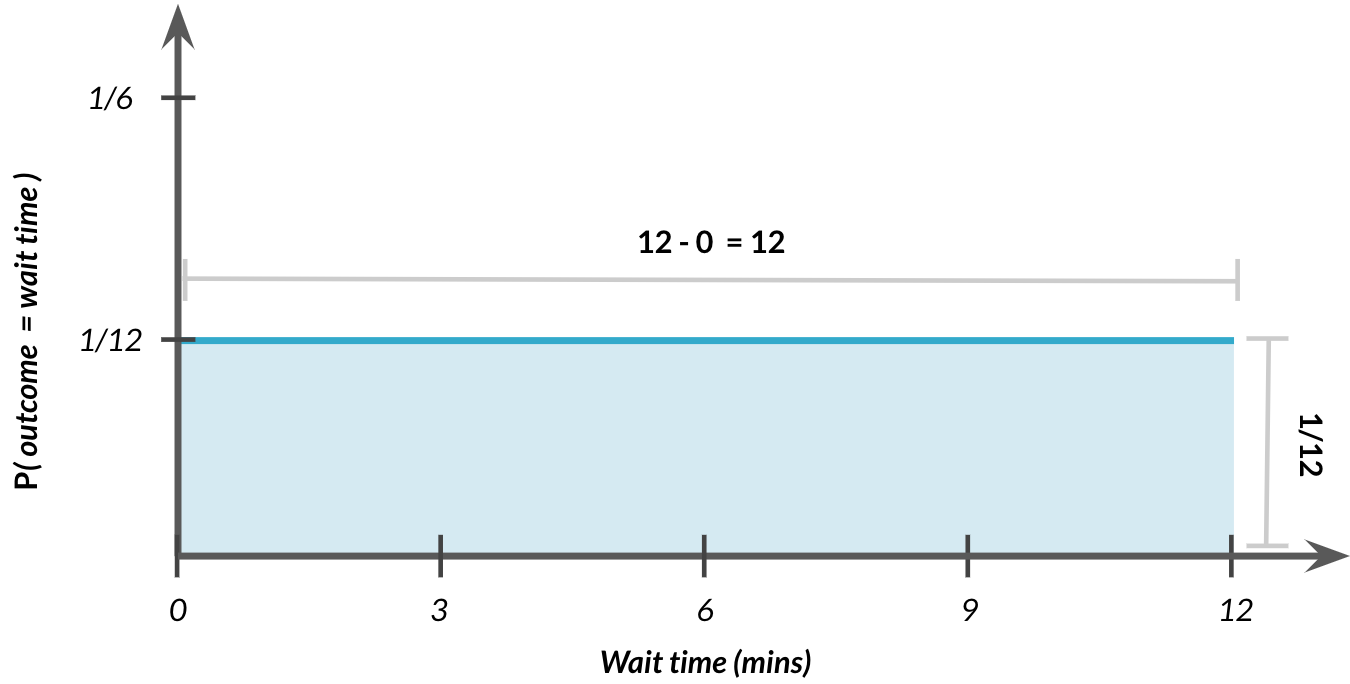
Width of distribution = 1, height = 1/12

Introduction to Statistics in R

Other continuous distributions


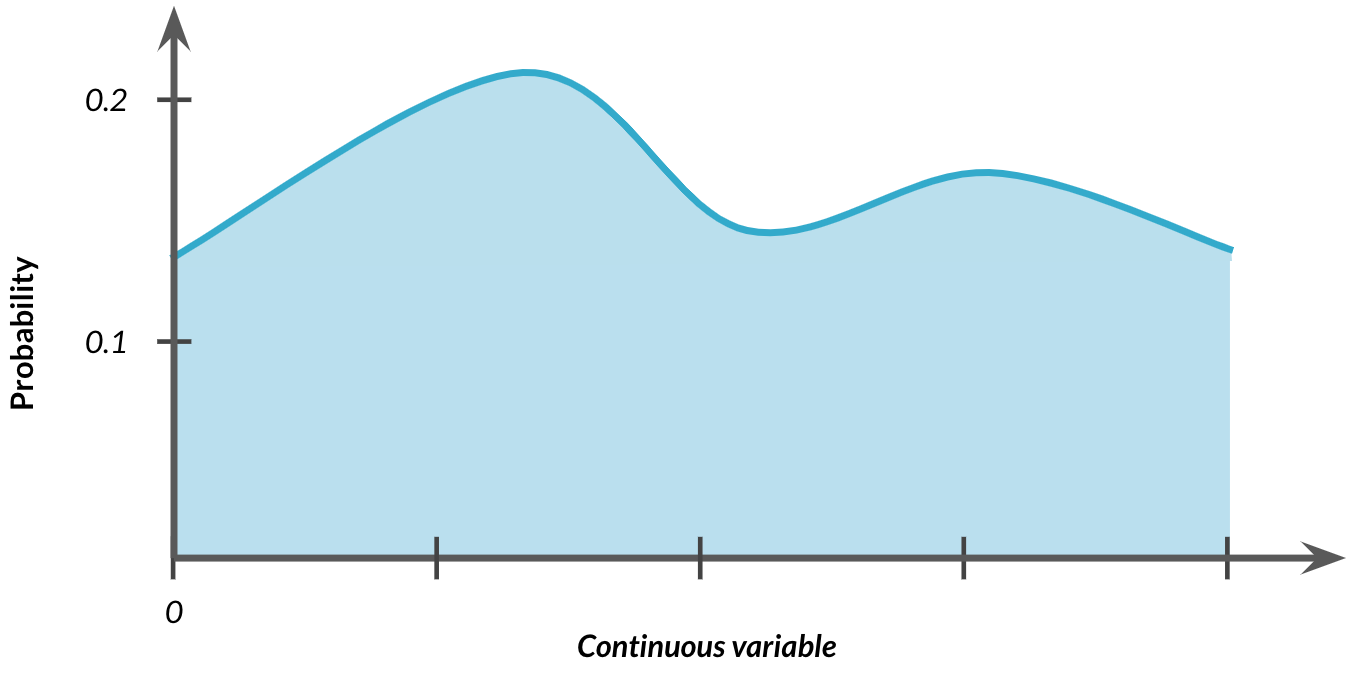
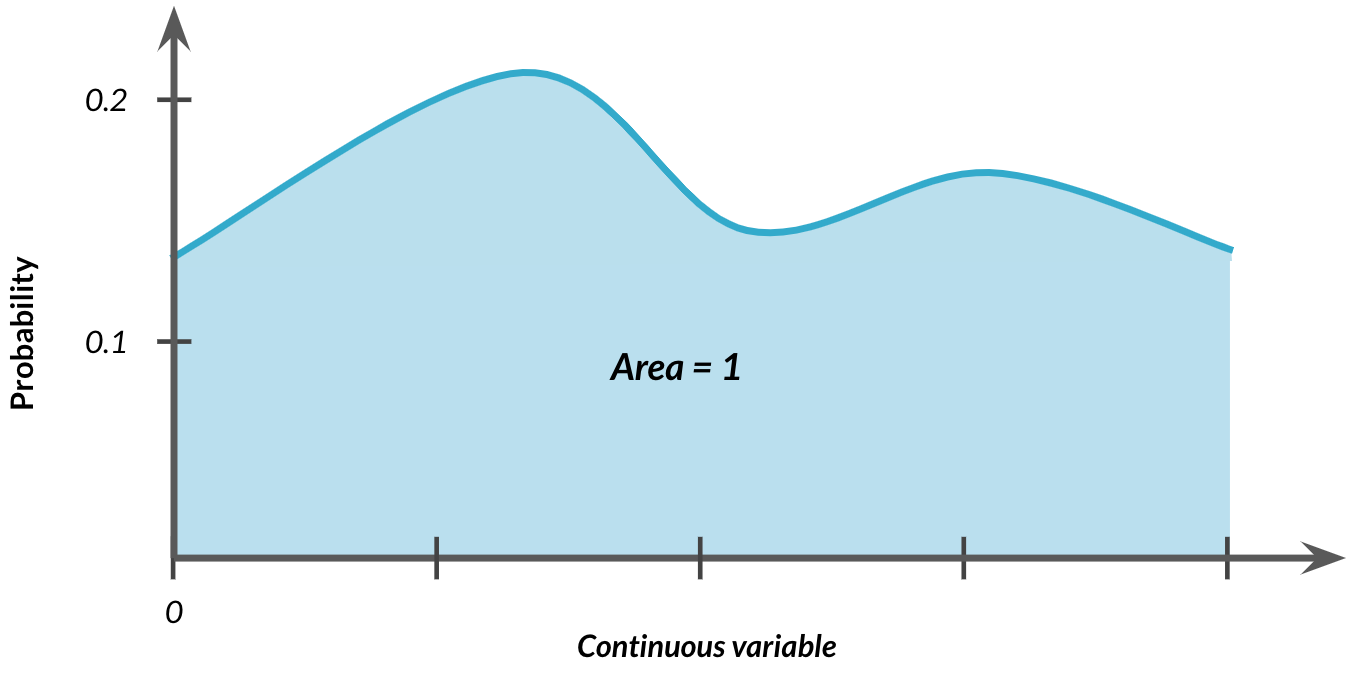
Distribution with 2 peaks


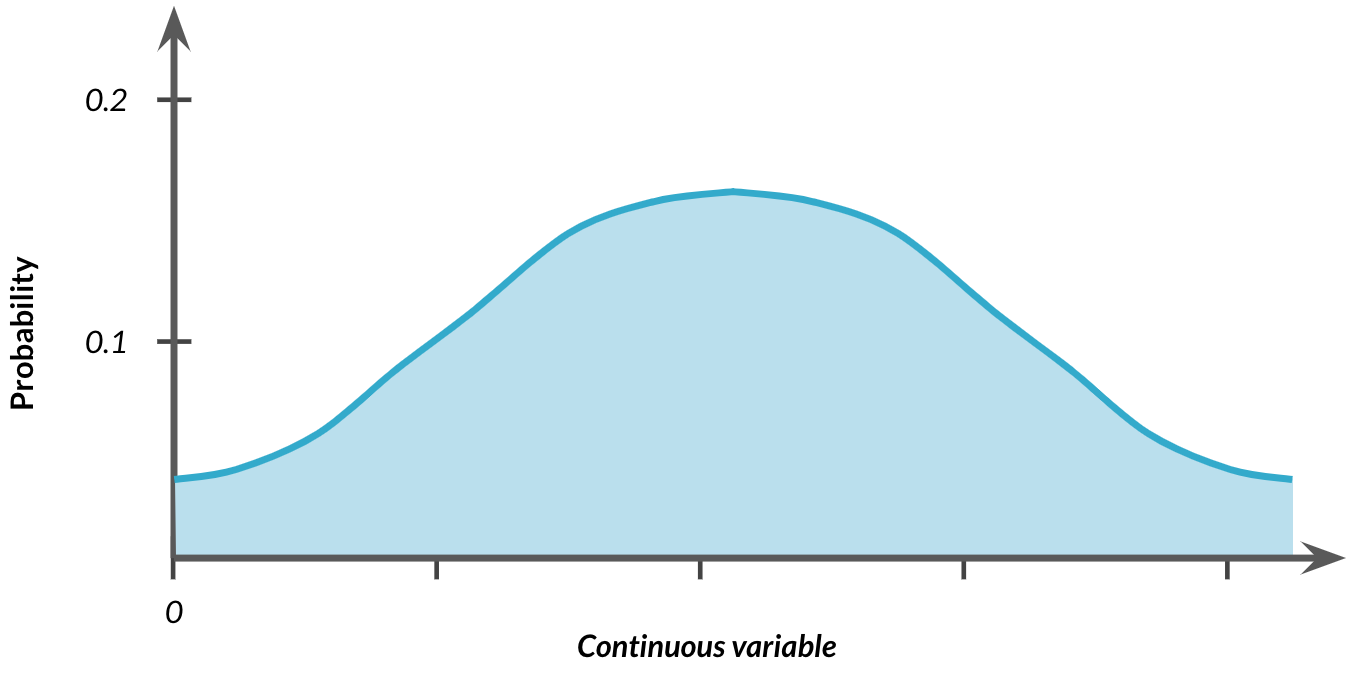
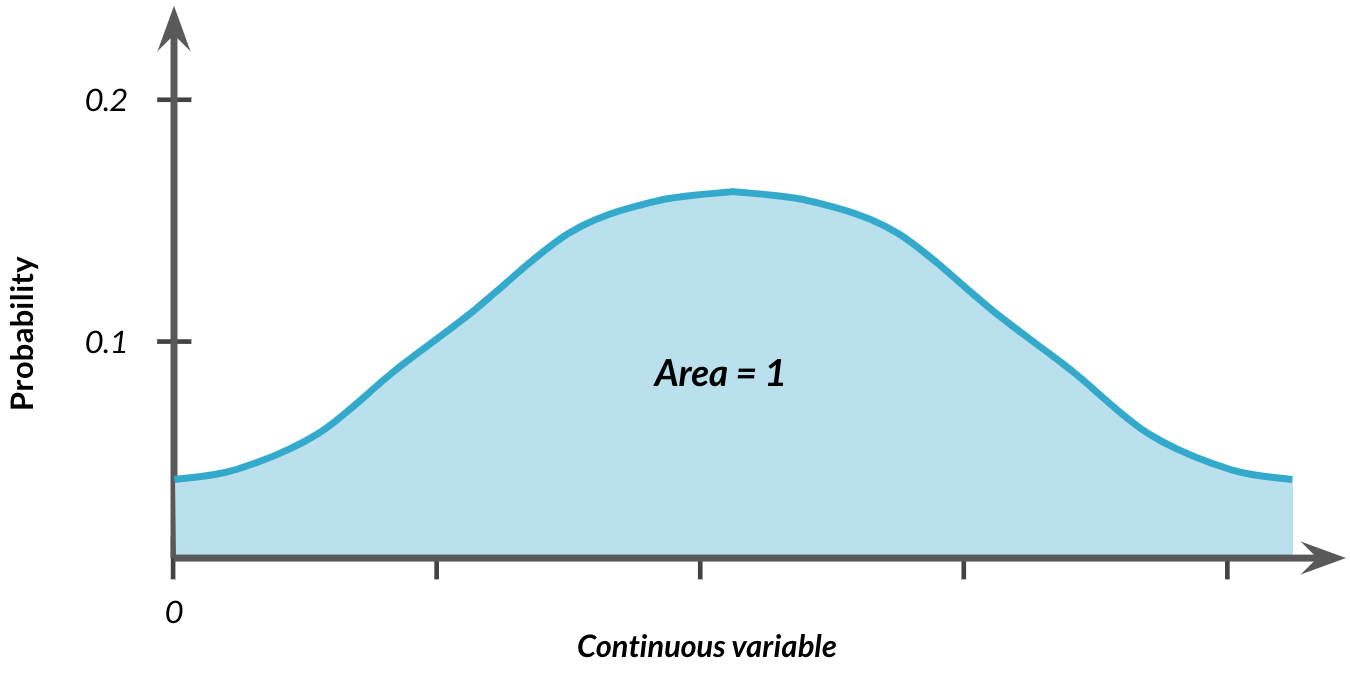
bell-curve shaped distribution

Introduction to Statistics in R

Other continuous distributions


Highlighted area under curve with text: area = 1


Highlighted area under bell-curve with text: area = 1

Introduction to Statistics in R

Other special types of distributions

Normal distribution

Plot of normal distribution

Poisson distribution
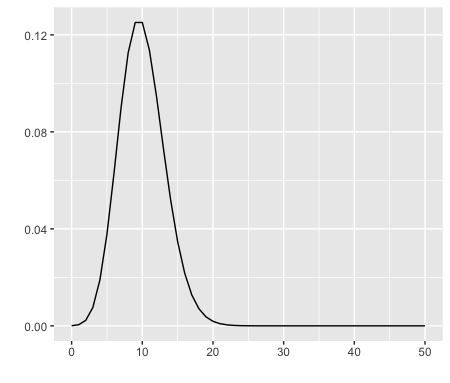
Plot of Poisson distribution

Introduction to Statistics in R

Let's practice!

Introduction to Statistics in R

Preparing Video For Download...